
Understanding Your Reports
A guide to every report in Adovance - what each one shows, and the decision it helps you make.
💡 Every report includes an AI Analysis narrative and a Download CSV button. Most honor the 7 / 30 / 90 day report window selector.
Overview
The landing page. Leads with an AI Executive Summary that synthesizes every report into a single narrative, plus your headline numbers: active %, license waste (in dollars), and ROI. If you set an internal adoption goal, progress toward it shows here too.
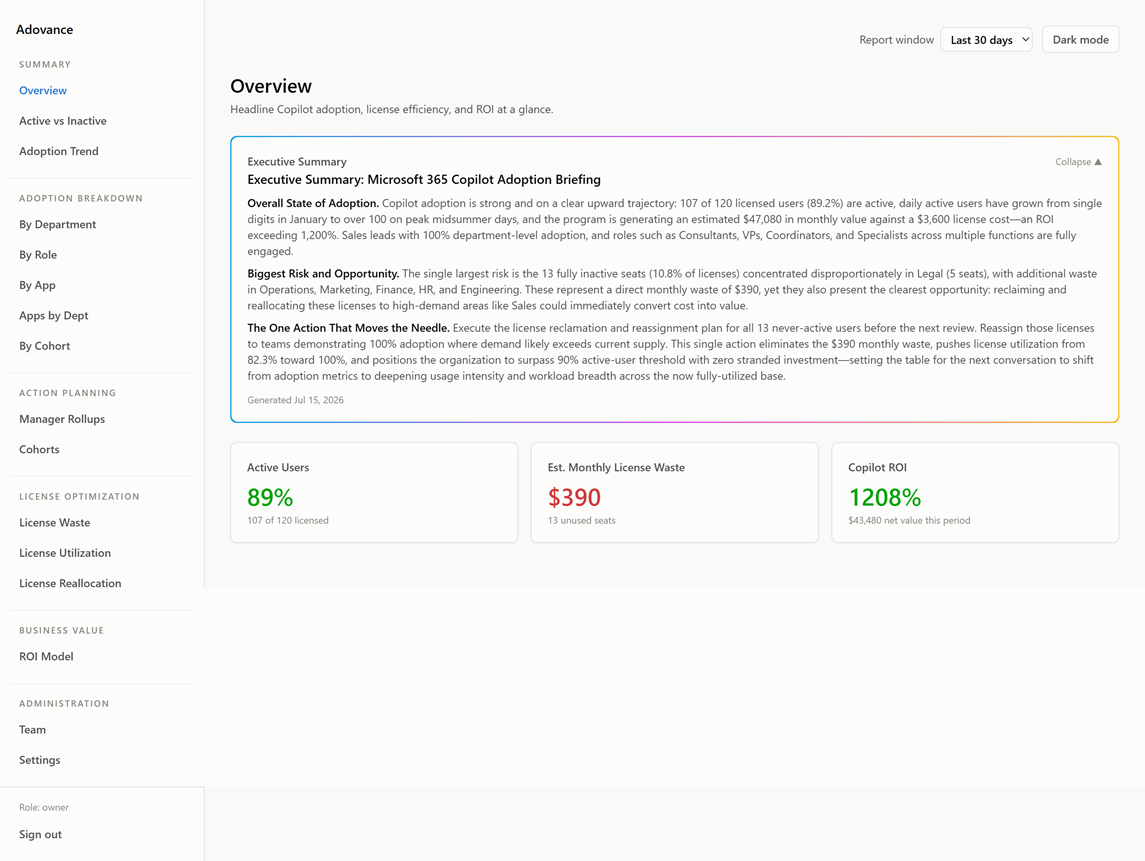
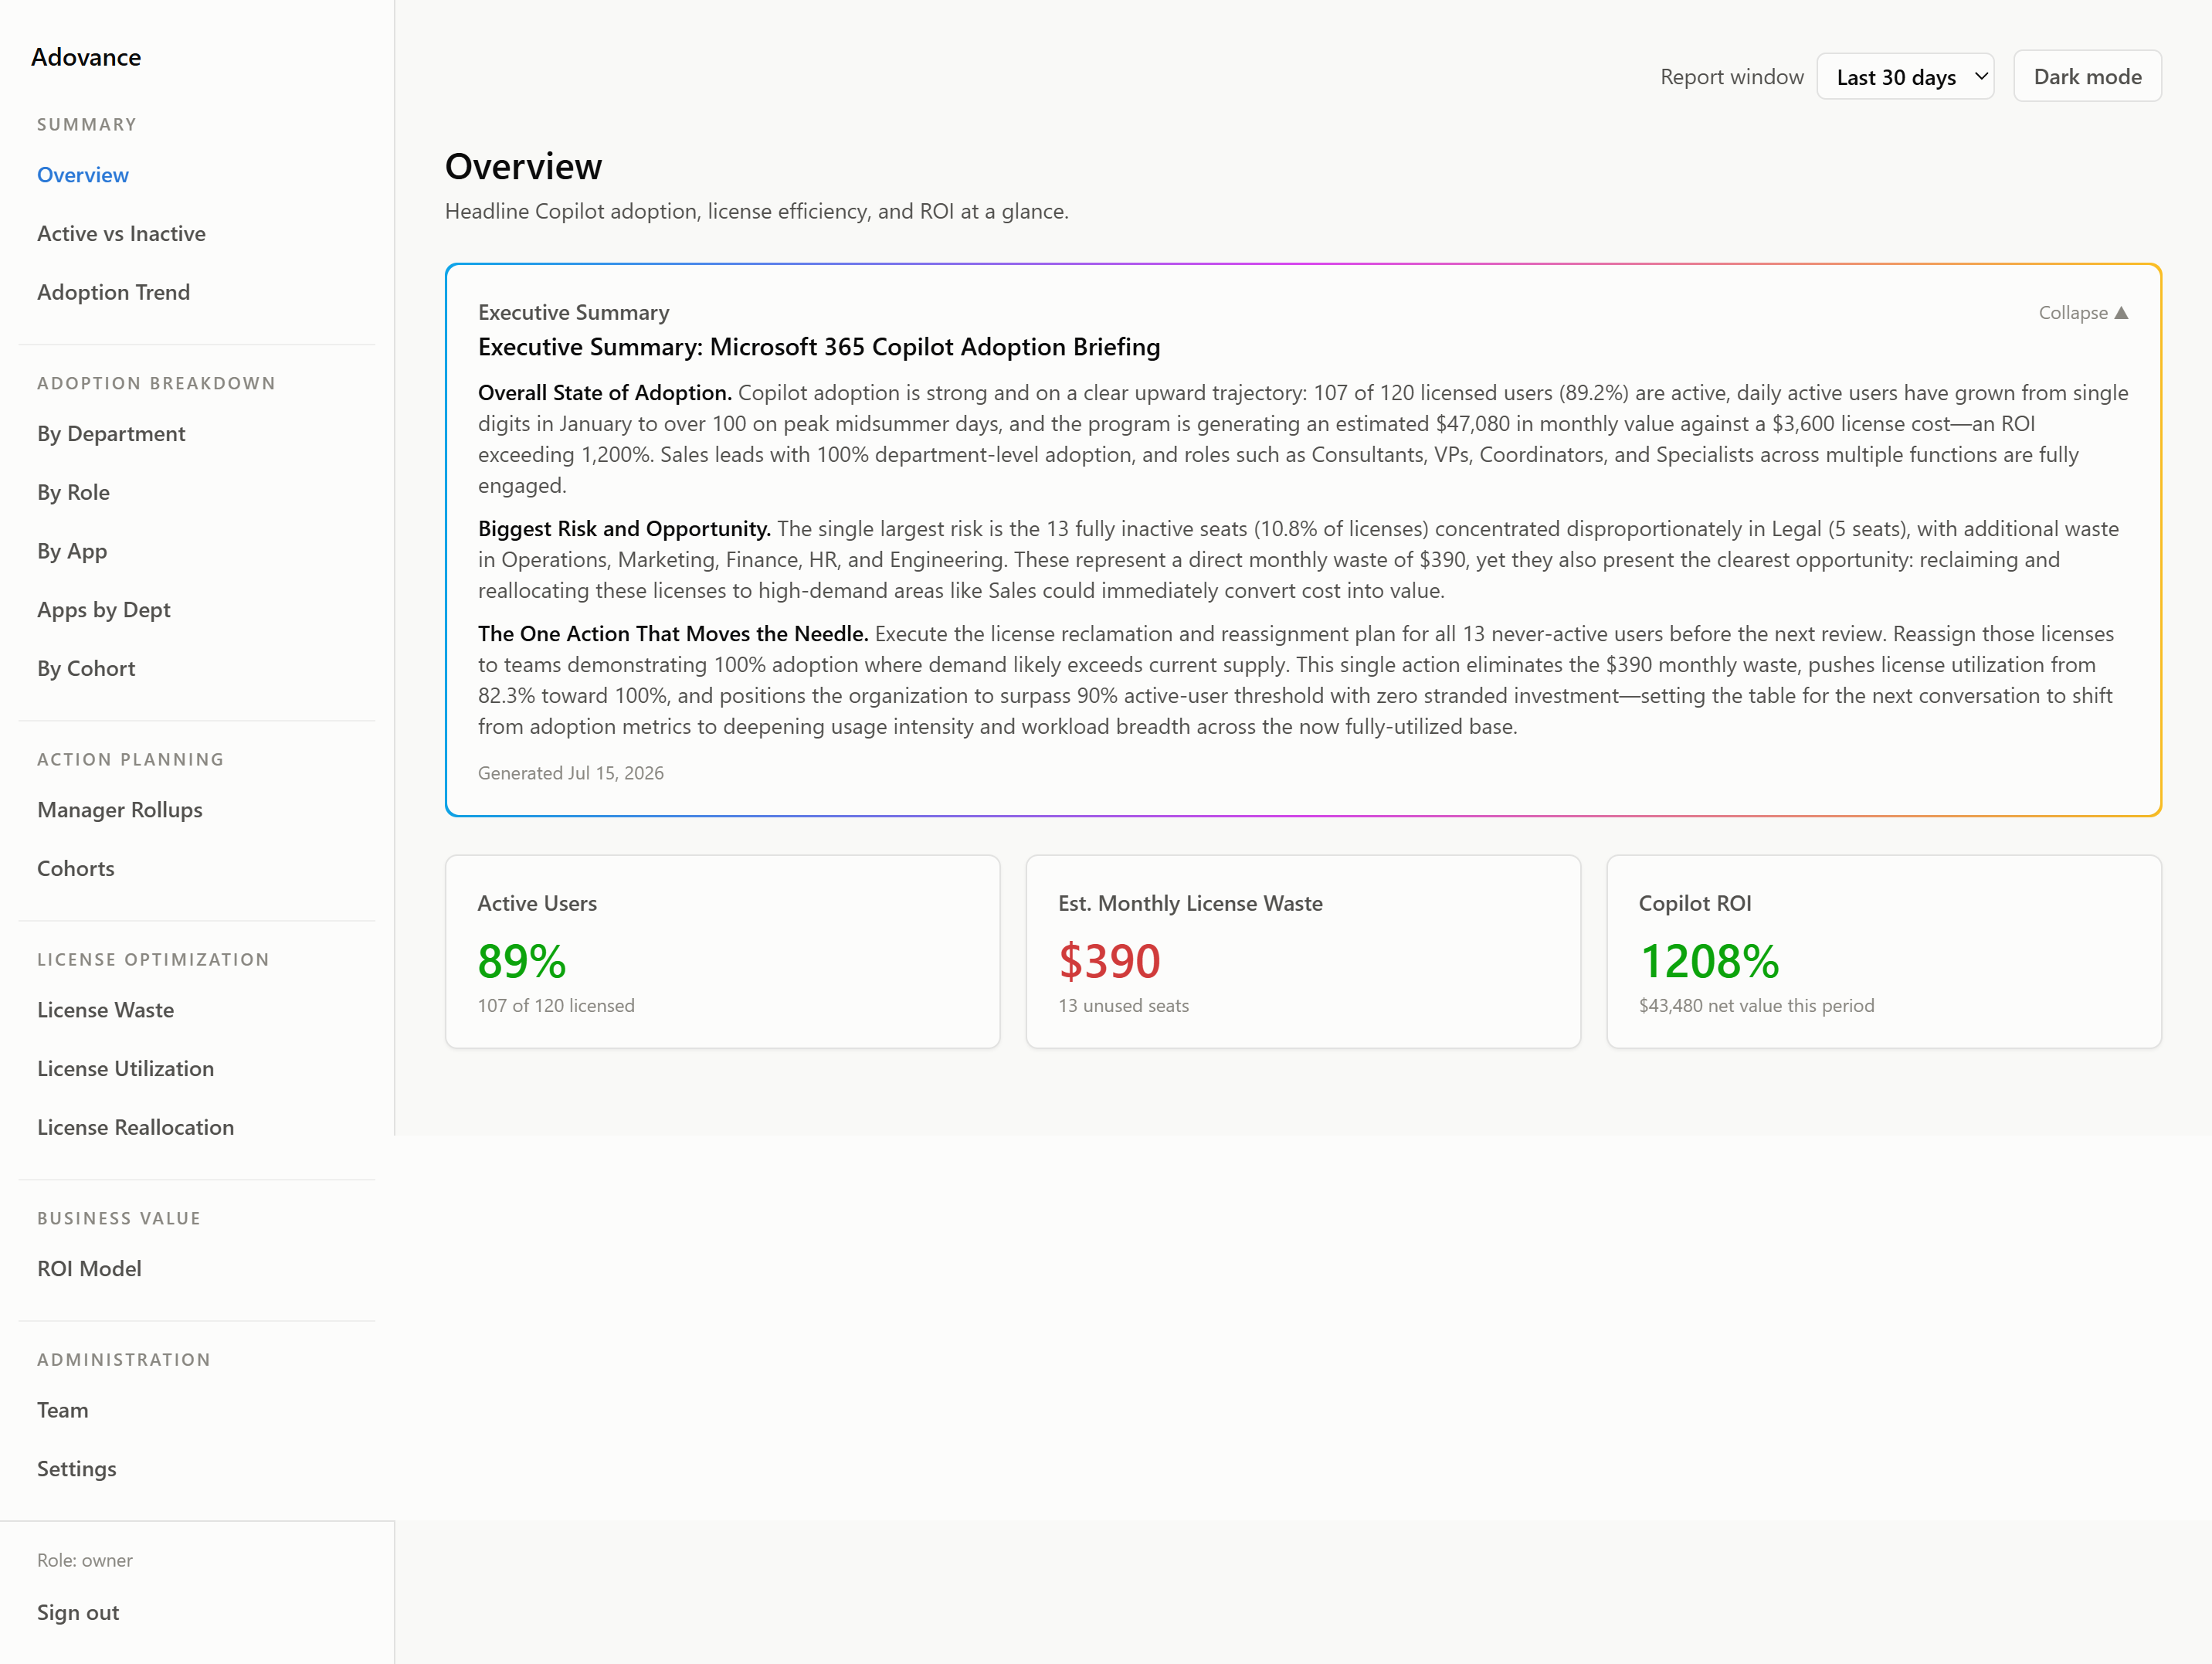
Use it to: brief a leader in 30 seconds.
Active vs Inactive
Splits your licensed users into active vs. inactive based on your inactivity threshold. Can optionally show:
- An internal adoption goal progress note.
- A peer benchmark - percentile bands vs. similar-sized organizations (only when enabled platform-wide and enough peer tenants exist; off by default).
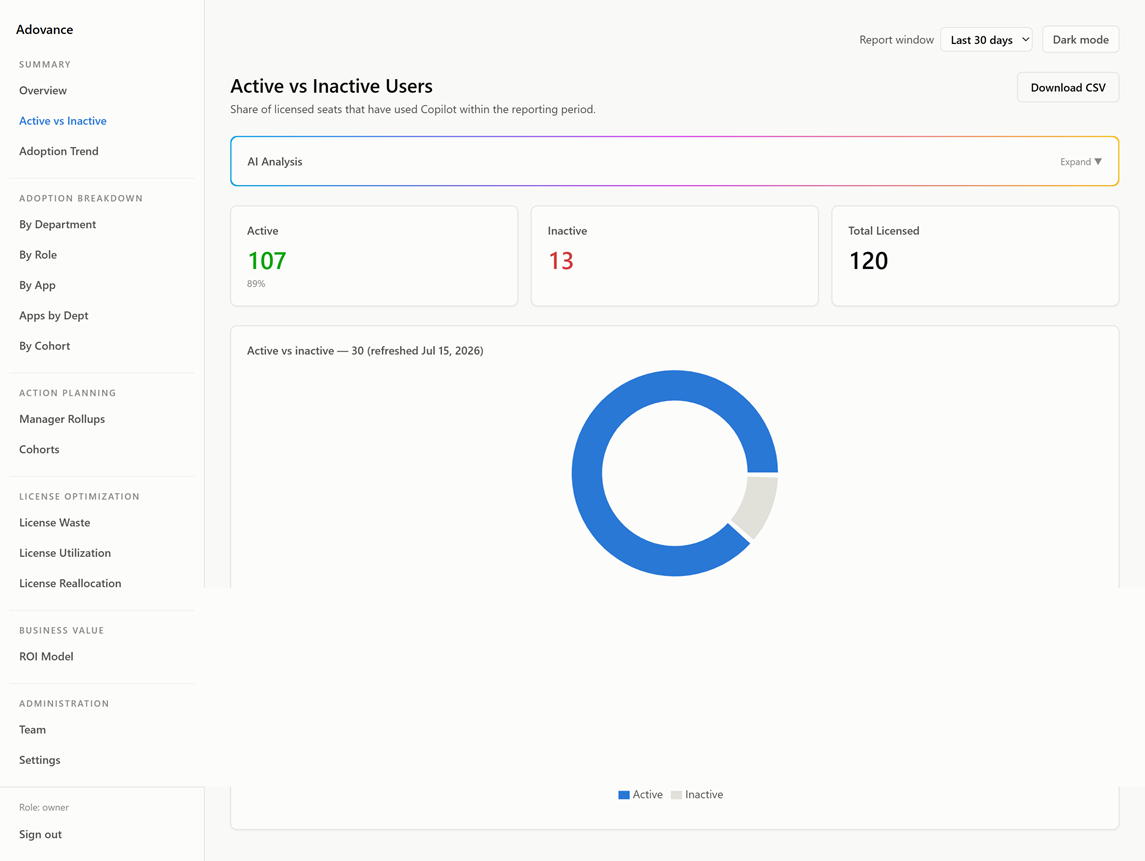
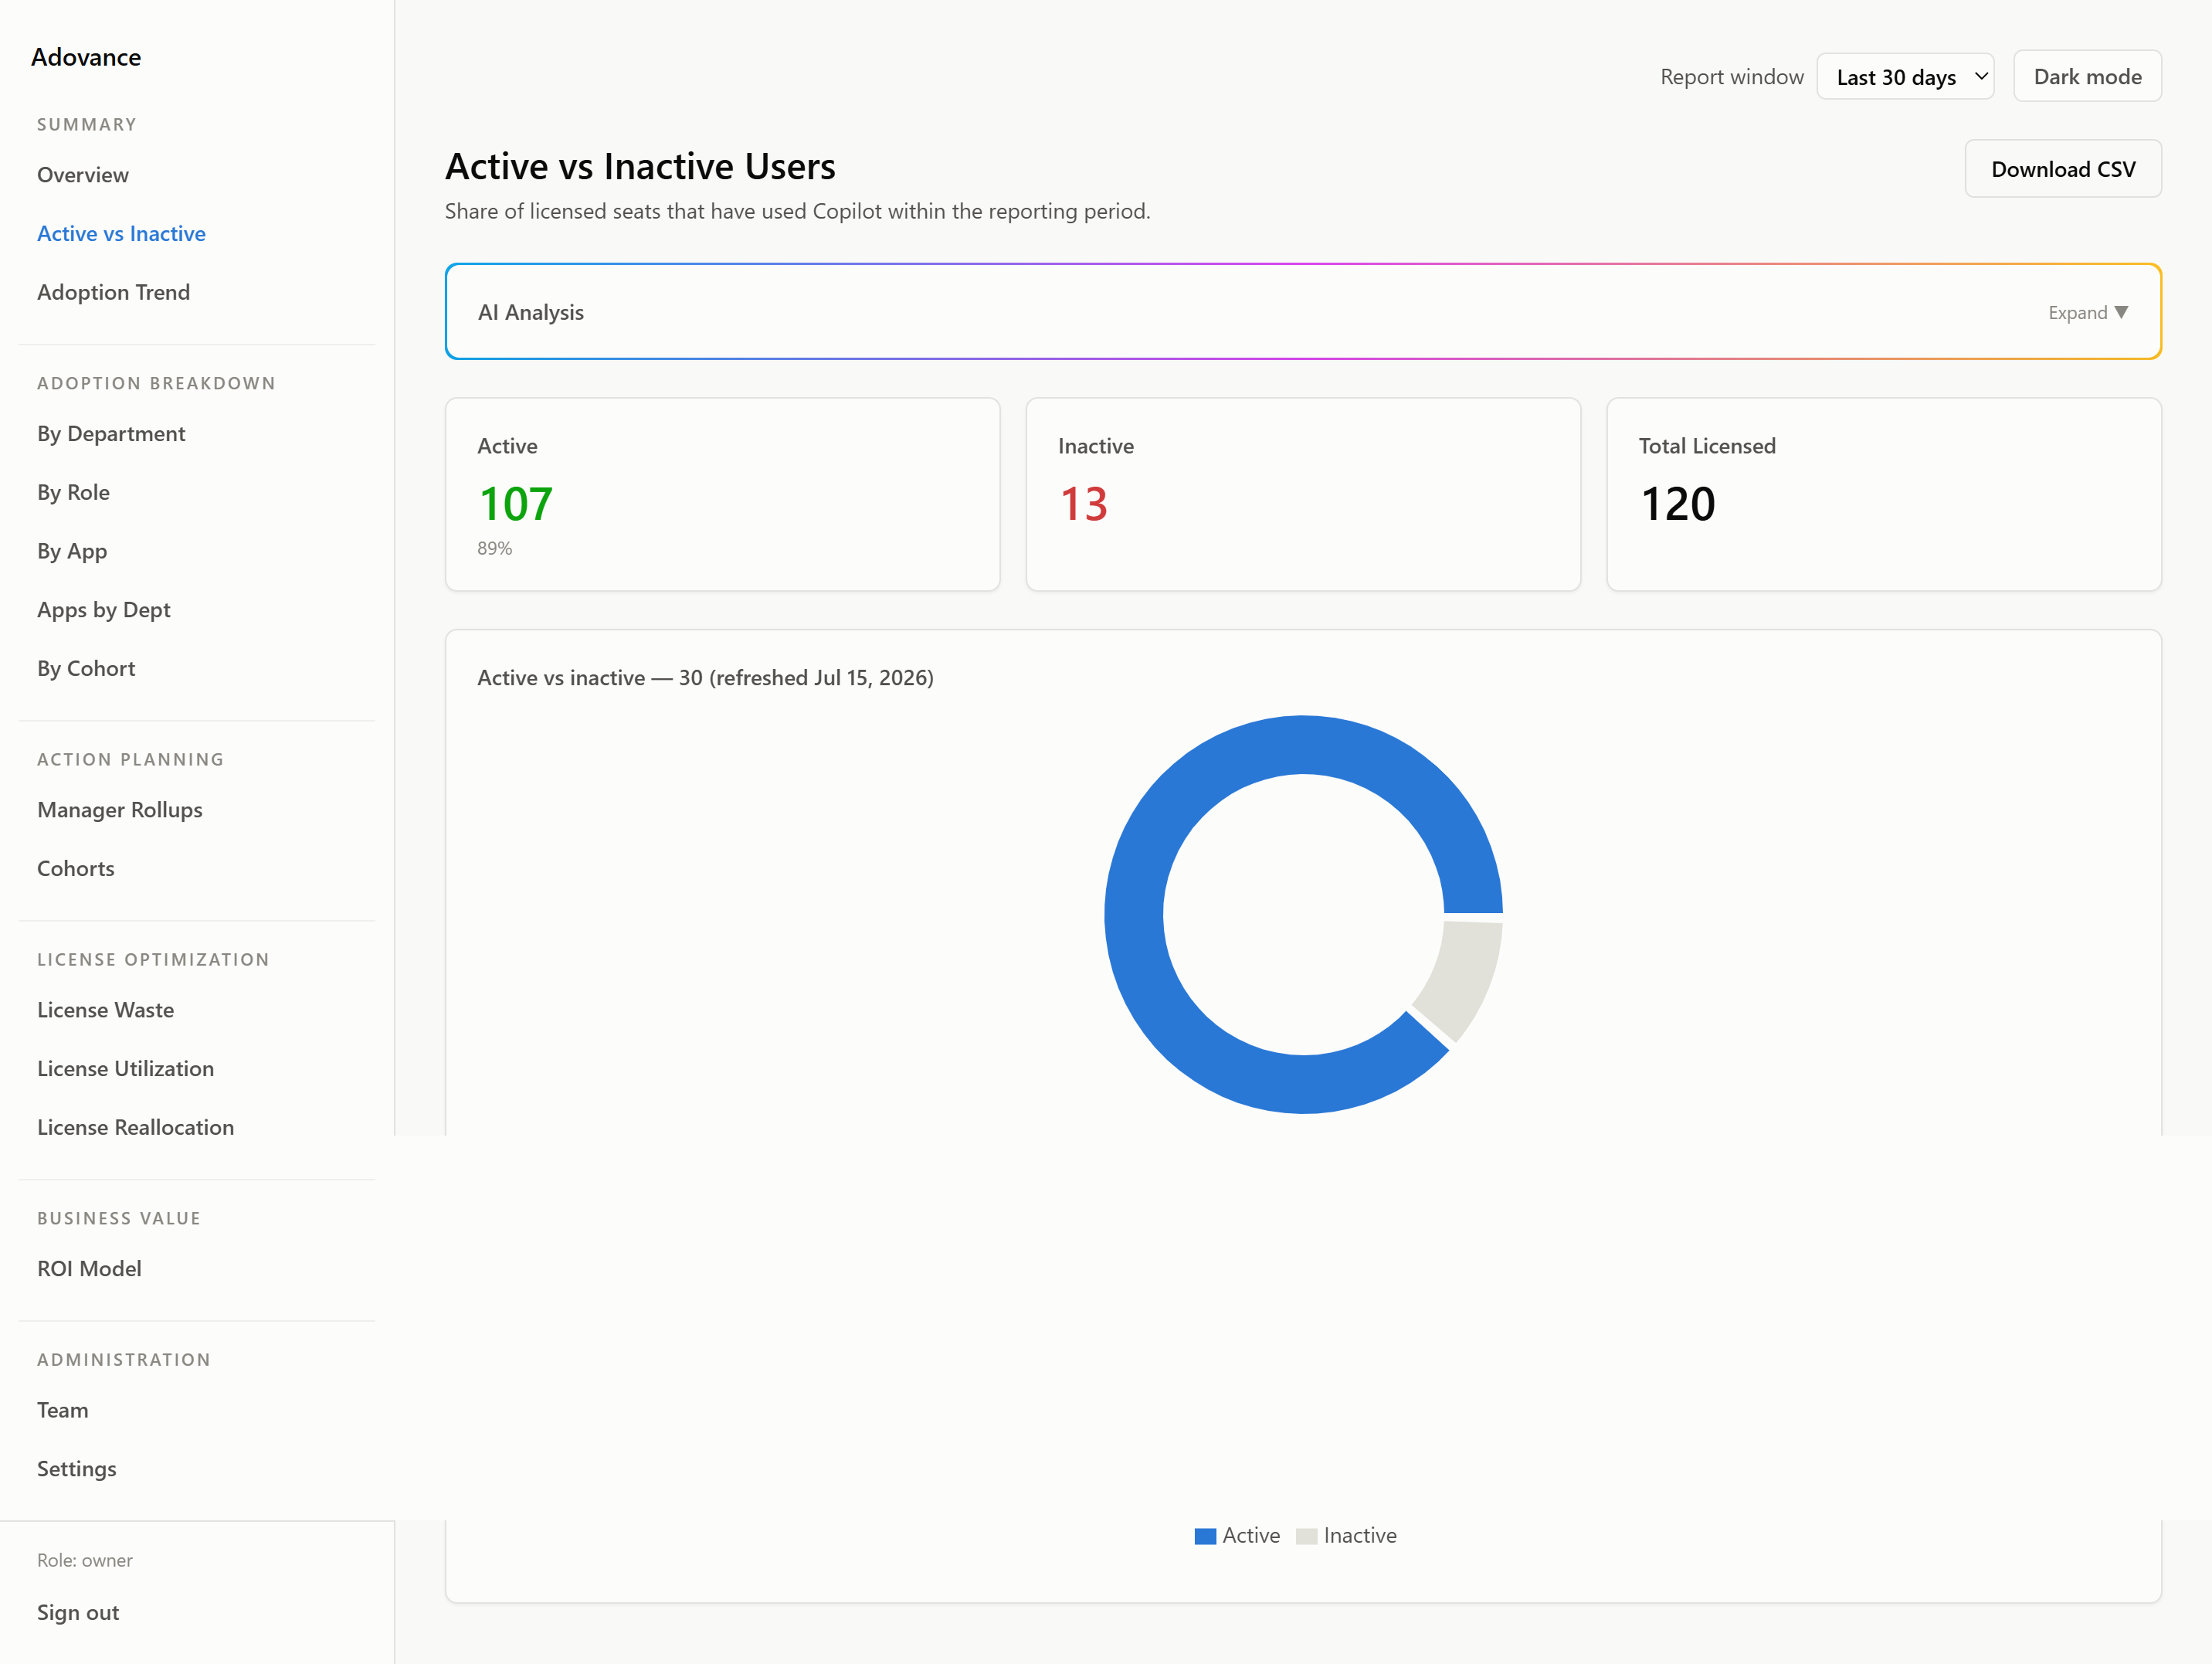
Use it to: quantify how many seats are actually being used.
Department Adoption
Adoption broken down by department, so you can see which teams are ahead and which are lagging.
Use it to: target enablement where it’s needed.
Role Adoption
Adoption broken down by job role/title.
Use it to: see whether the roles you expected to benefit are actually using Copilot.
Manager Rollups
Adoption rolled up by manager, covering a manager’s entire reporting chain - not just their direct reports.
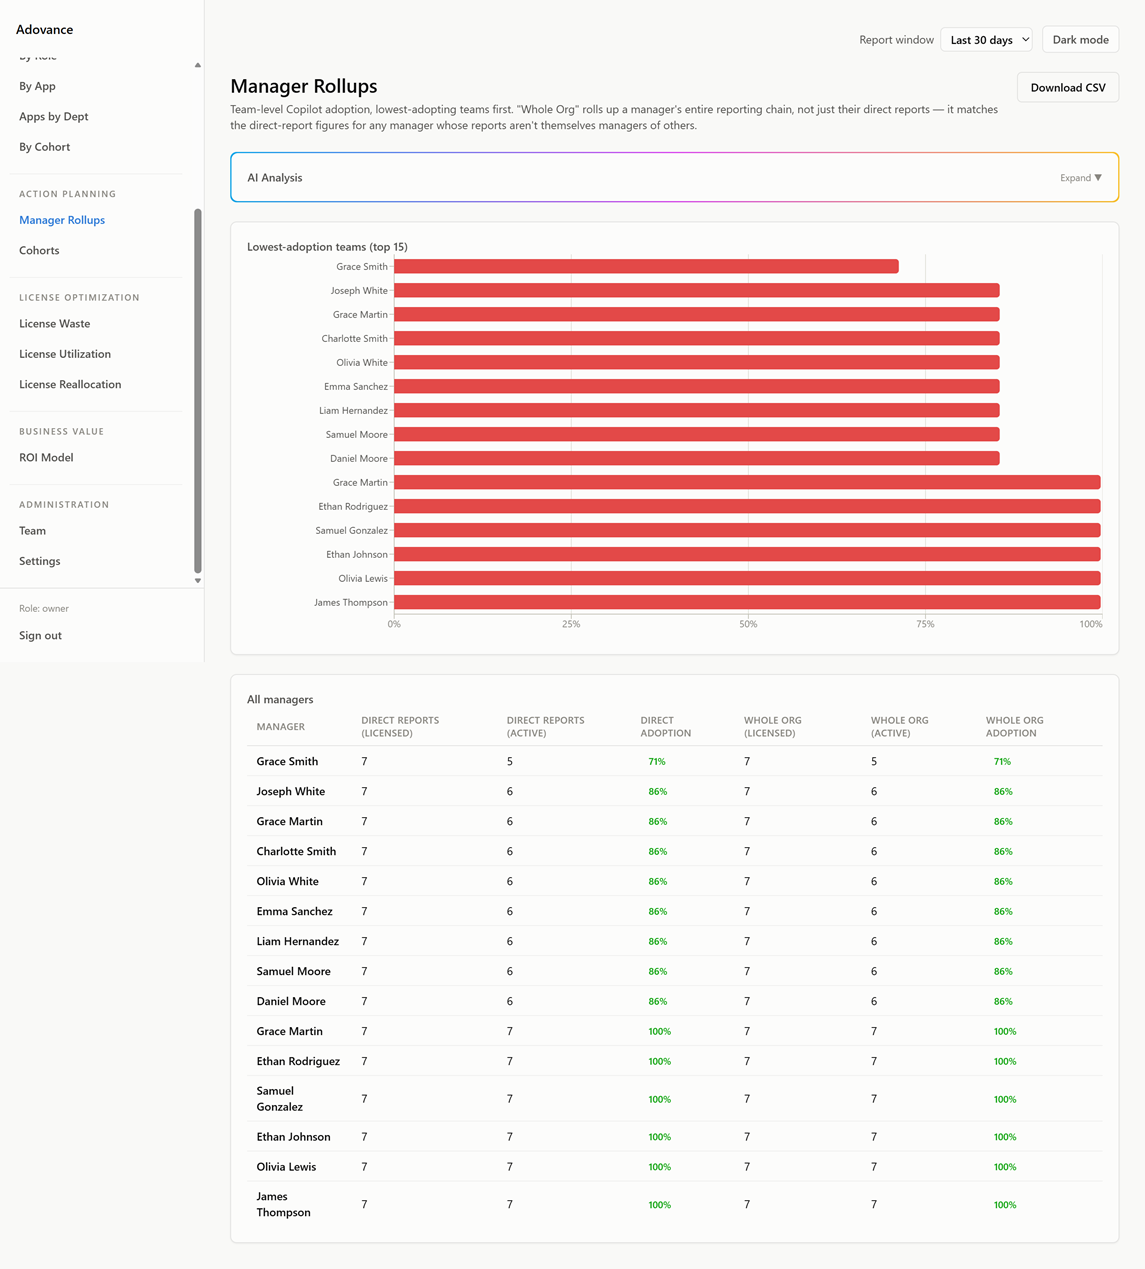
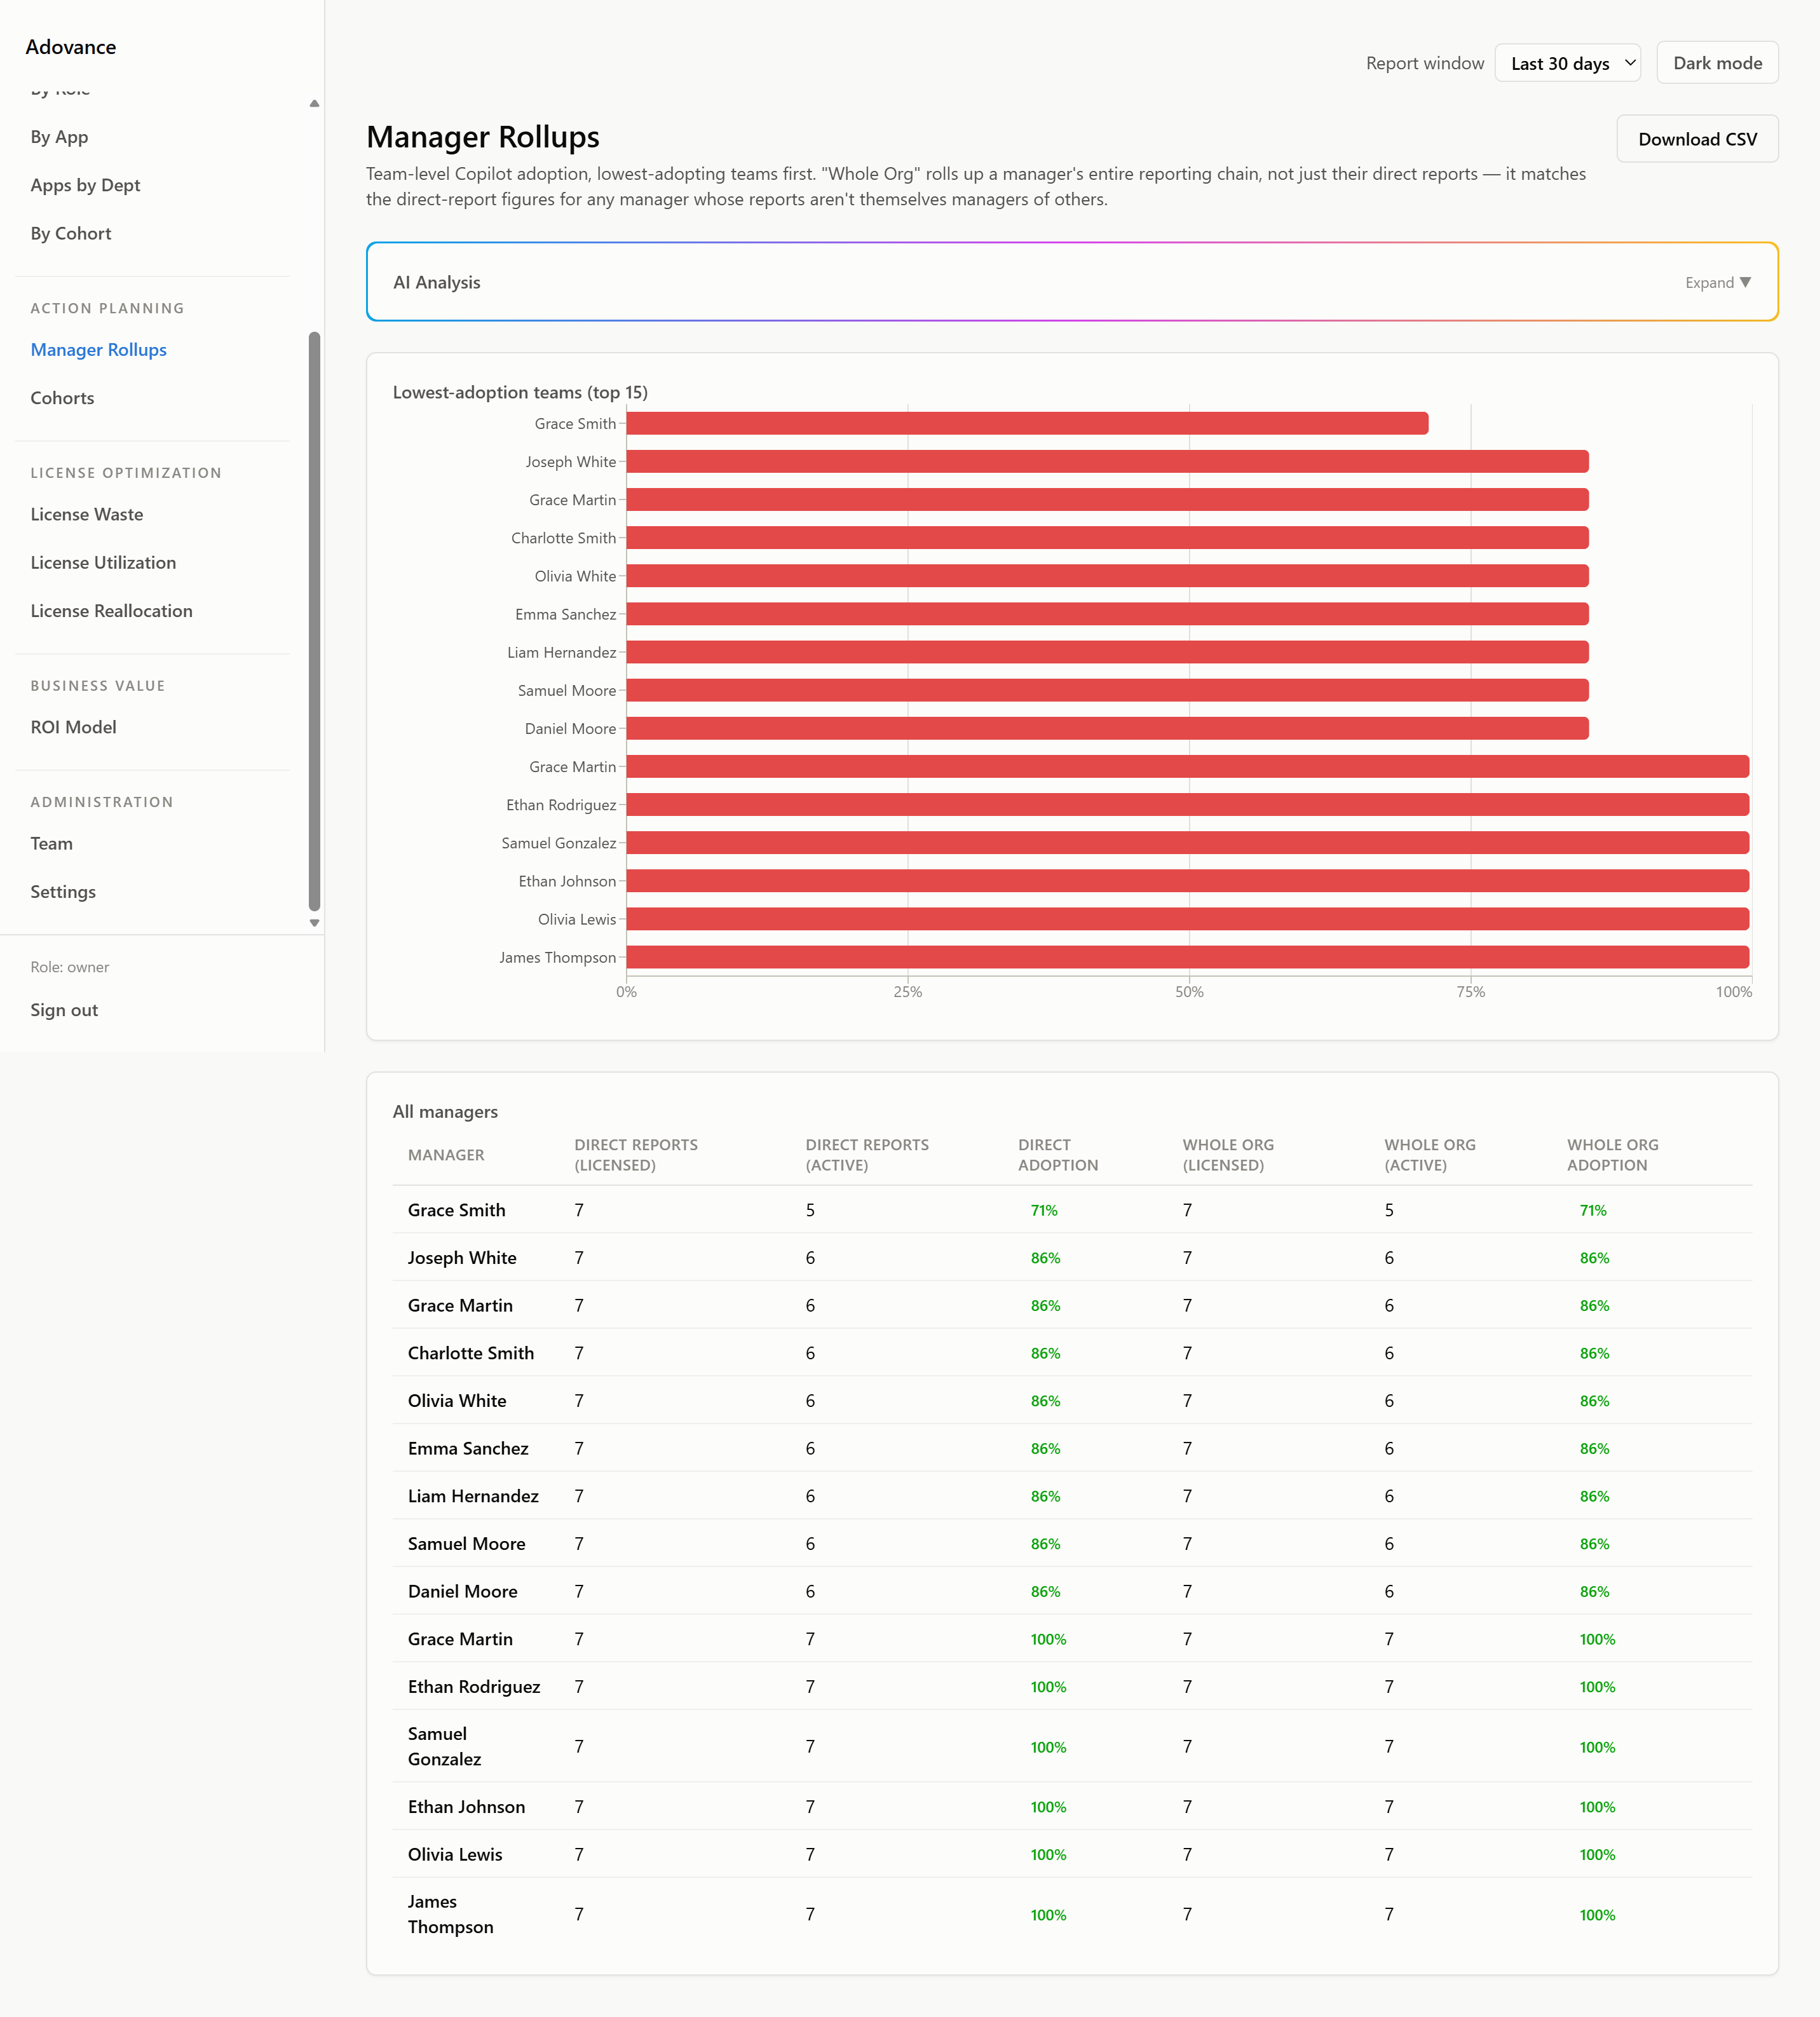
Use it to: give leaders accountability for adoption in their org.
Adoption Trend
Daily adoption over time. The first sync backfills ~6 months of history so this chart is populated immediately. Includes an Enabled / Active toggle per app.
📌 Not affected by the 7/30/90 report window selector (different Graph report family).
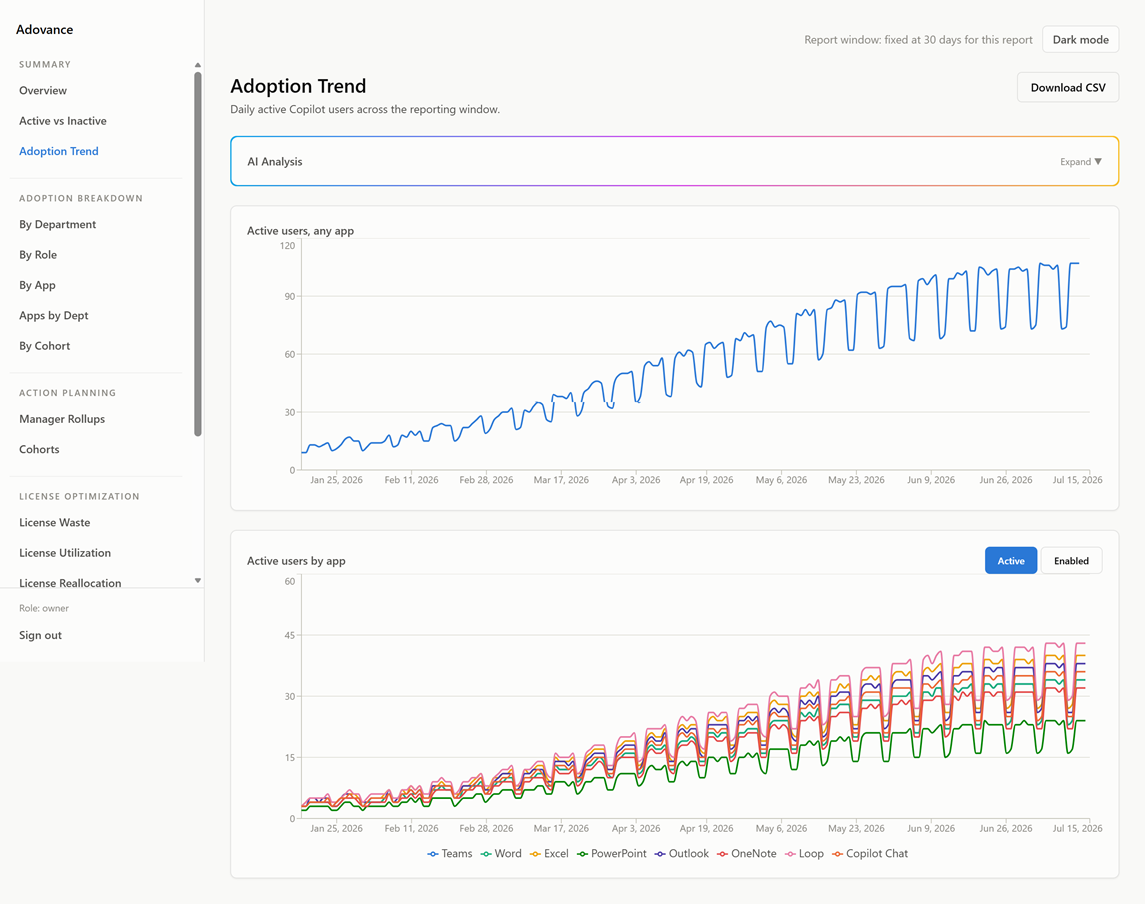
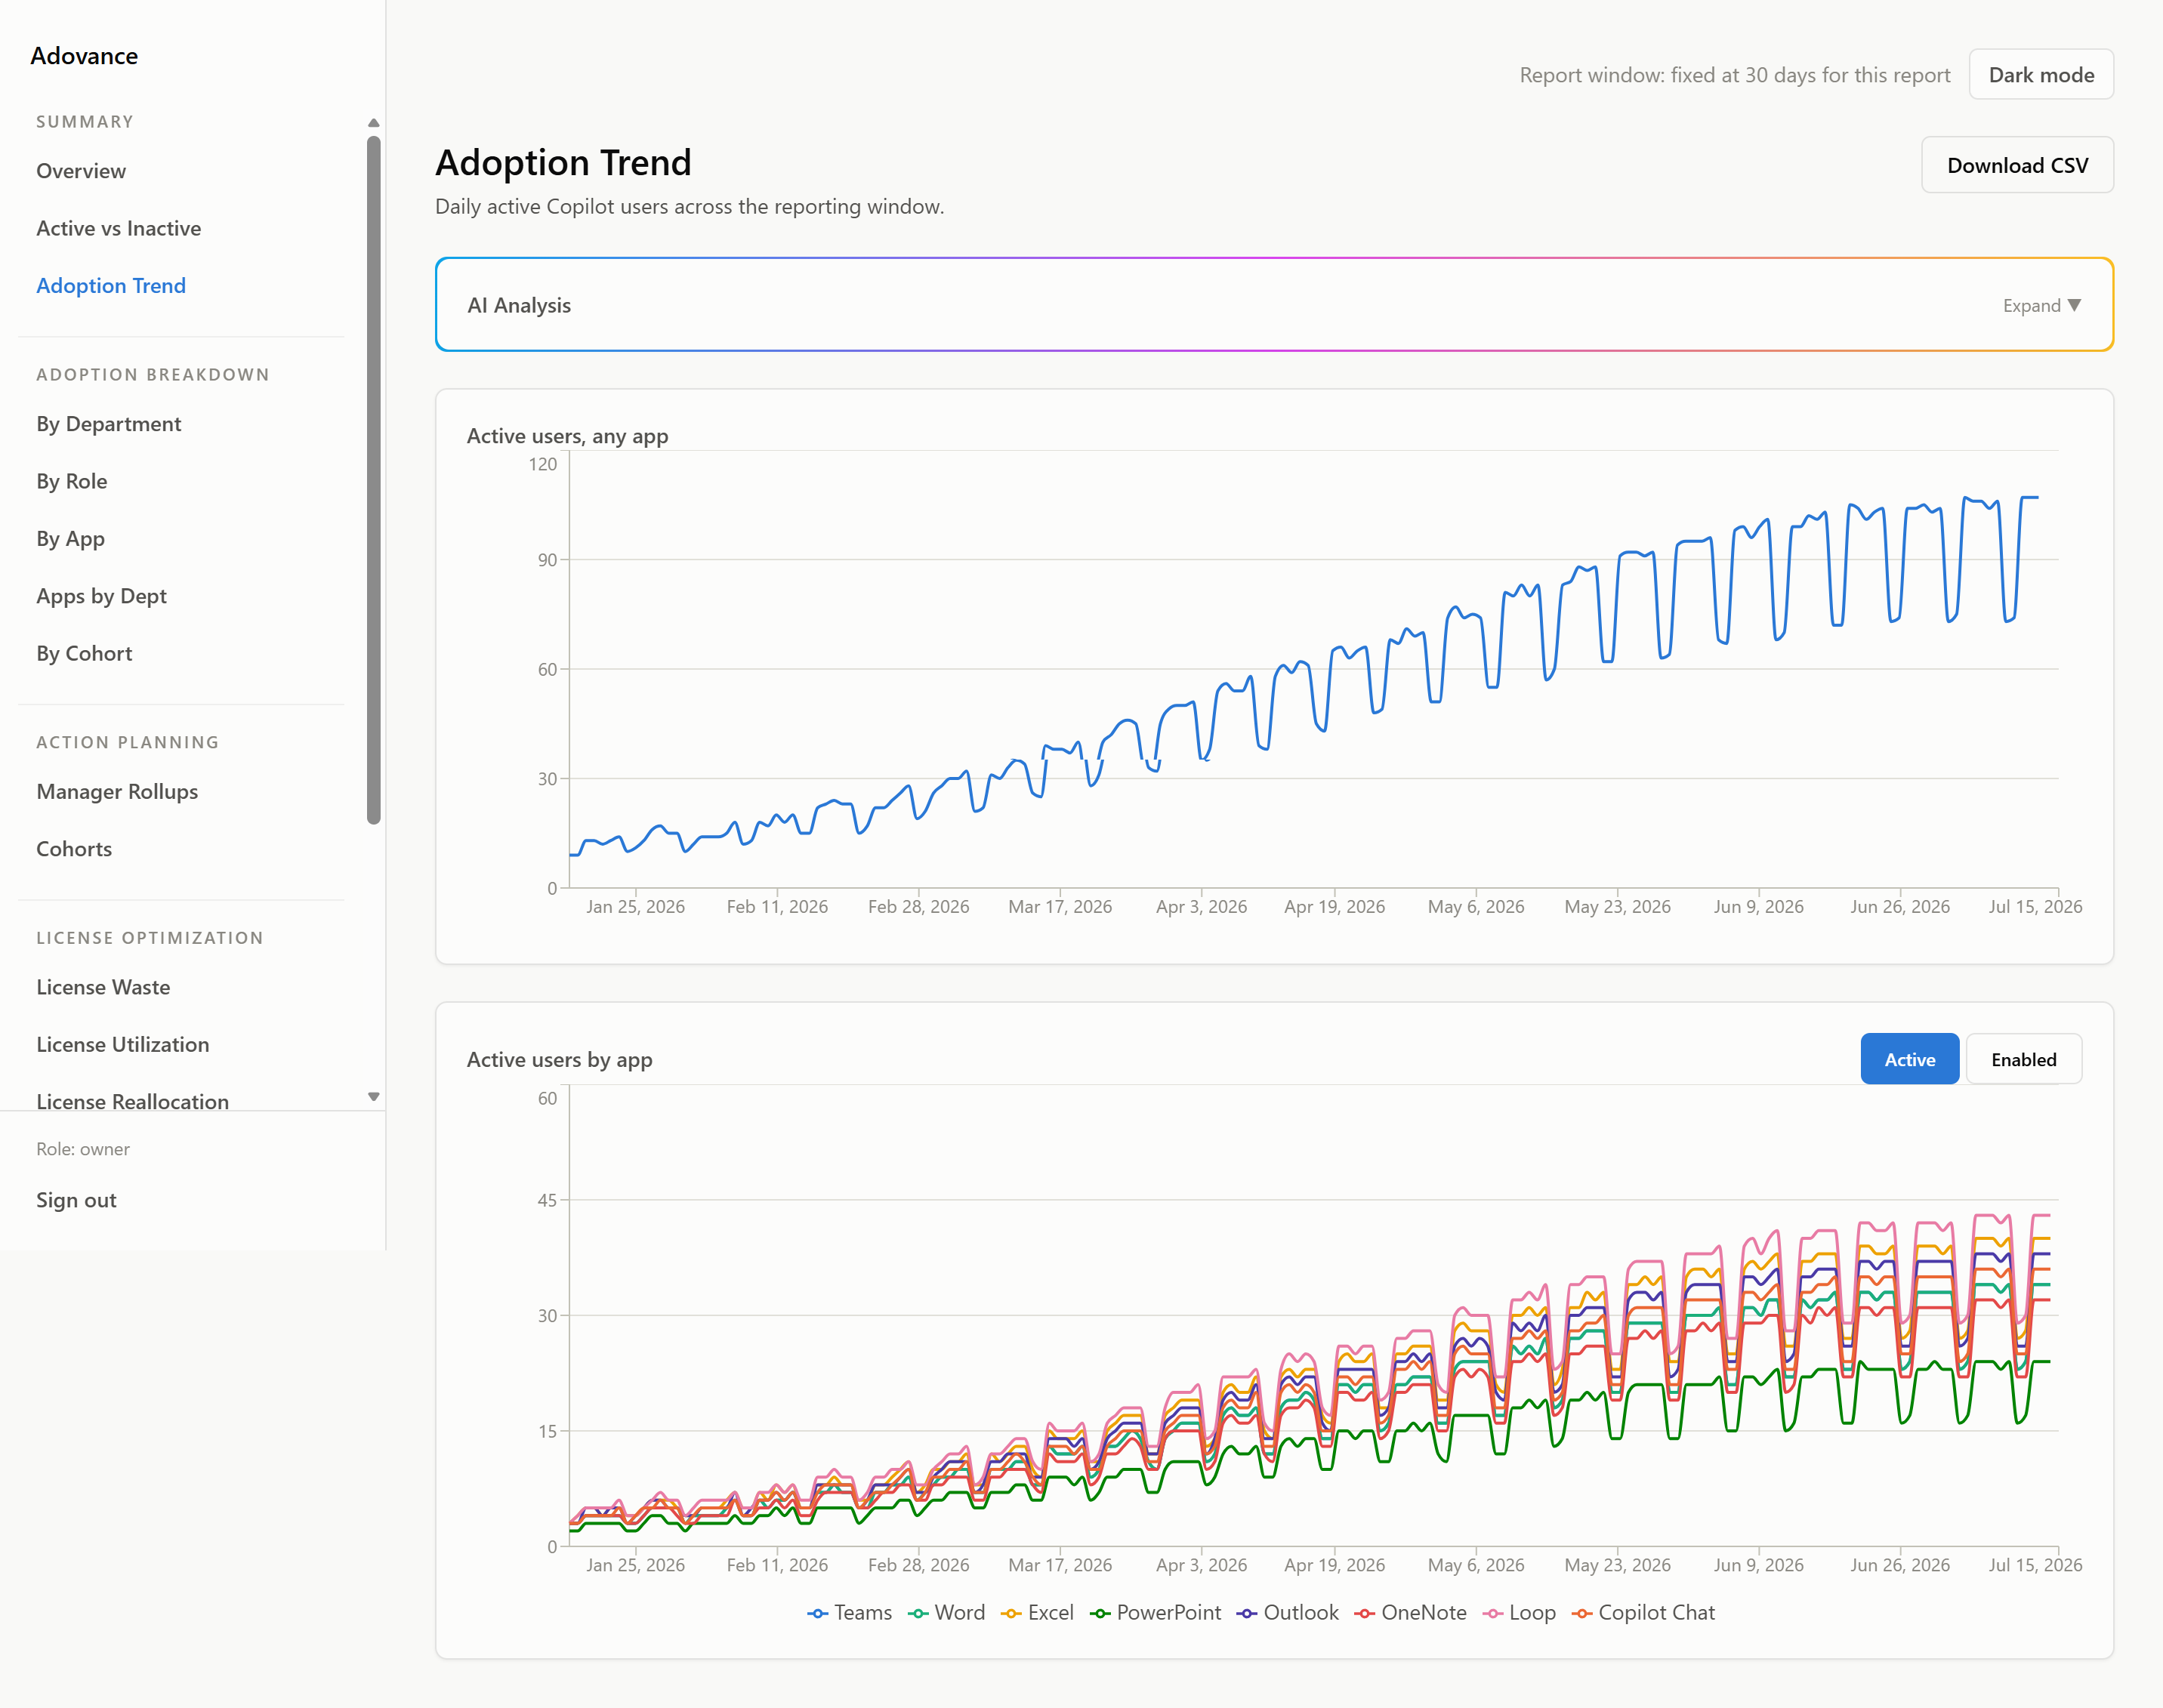
Use it to: show the trajectory to your board.
App Adoption
Adoption by individual Copilot surface (e.g. Copilot Chat, Word, Excel, Teams). Holds a single latest snapshot per tenant, so it shows a week-over-week delta badge and links to Adoption Trend rather than its own long-term chart.
📌 Not affected by the 7/30/90 report window selector.
Use it to: see which Copilot experiences are landing.
App Adoption by Department
Crosses per-user, per-app activity with department - so “Sales uses Copilot Chat but rarely Excel Copilot” is visible directly, not hidden inside a blended number.
Use it to: tailor training per team and per app.
Cohort Adoption
Adoption by admin-defined tag (cohort). Define cohorts on the Cohorts page.
Use it to: track adoption for a pilot group, region, or any grouping you care about.
License Waste
Idle licenses quantified in real dollars, using your license cost and inactivity threshold from Settings.
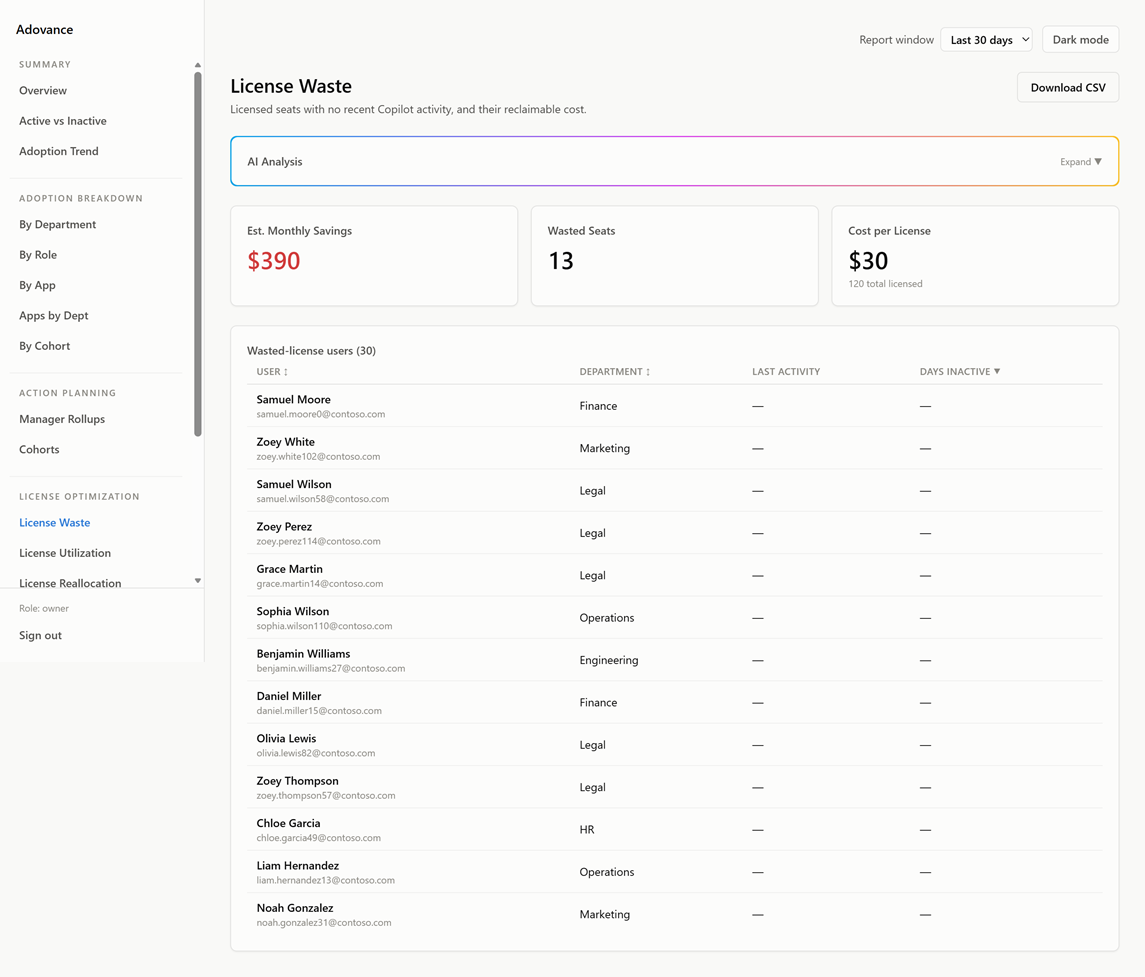
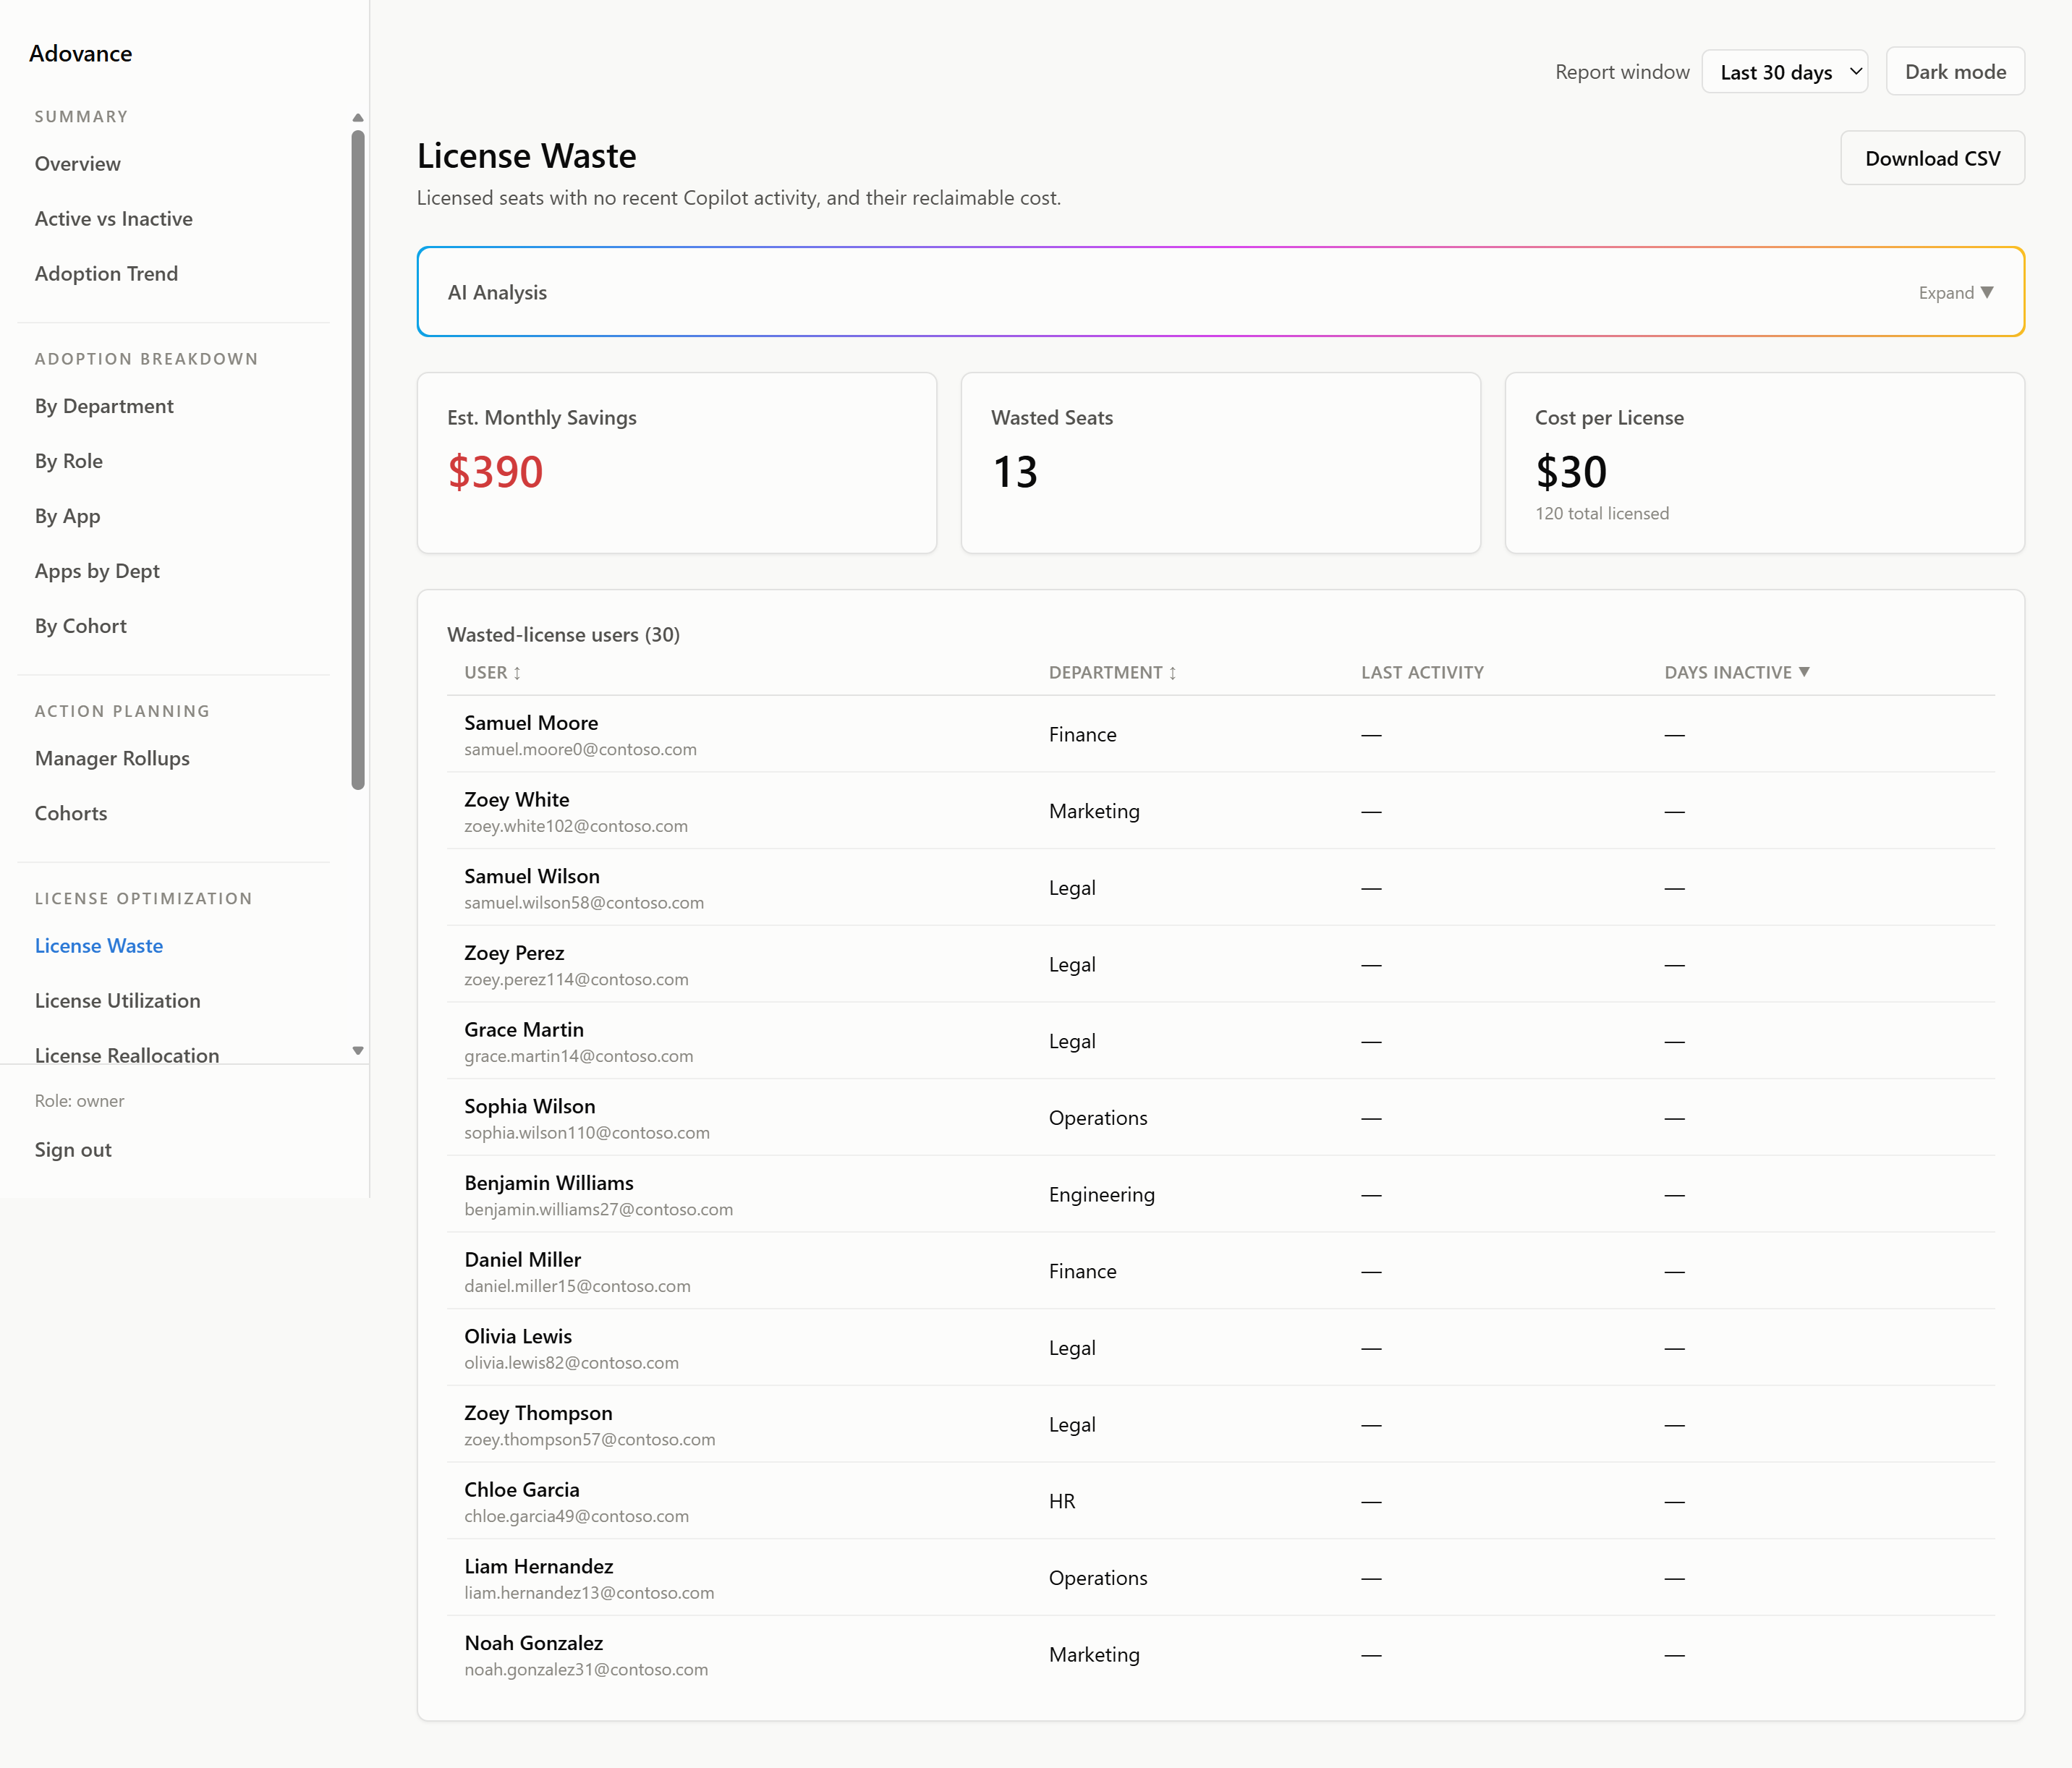
Use it to: put a number on wasted spend.
License Reallocation
A reclaim-and-reallocate action plan. A second table suggests which departments are the best candidates for reclaimed seats.
Use it to: turn waste into a concrete plan.
License Utilization
Joins purchased, assigned, and active seats per Copilot SKU - the procurement view License Waste only answers in aggregate.
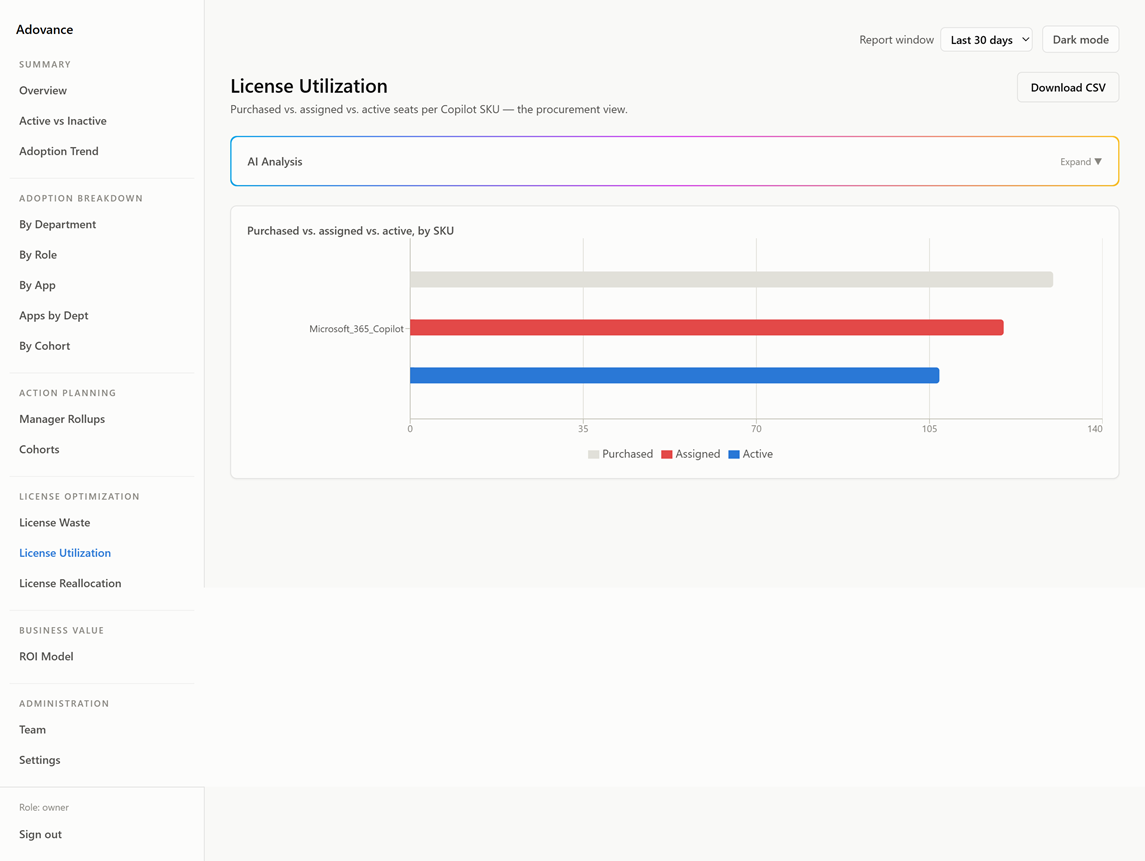
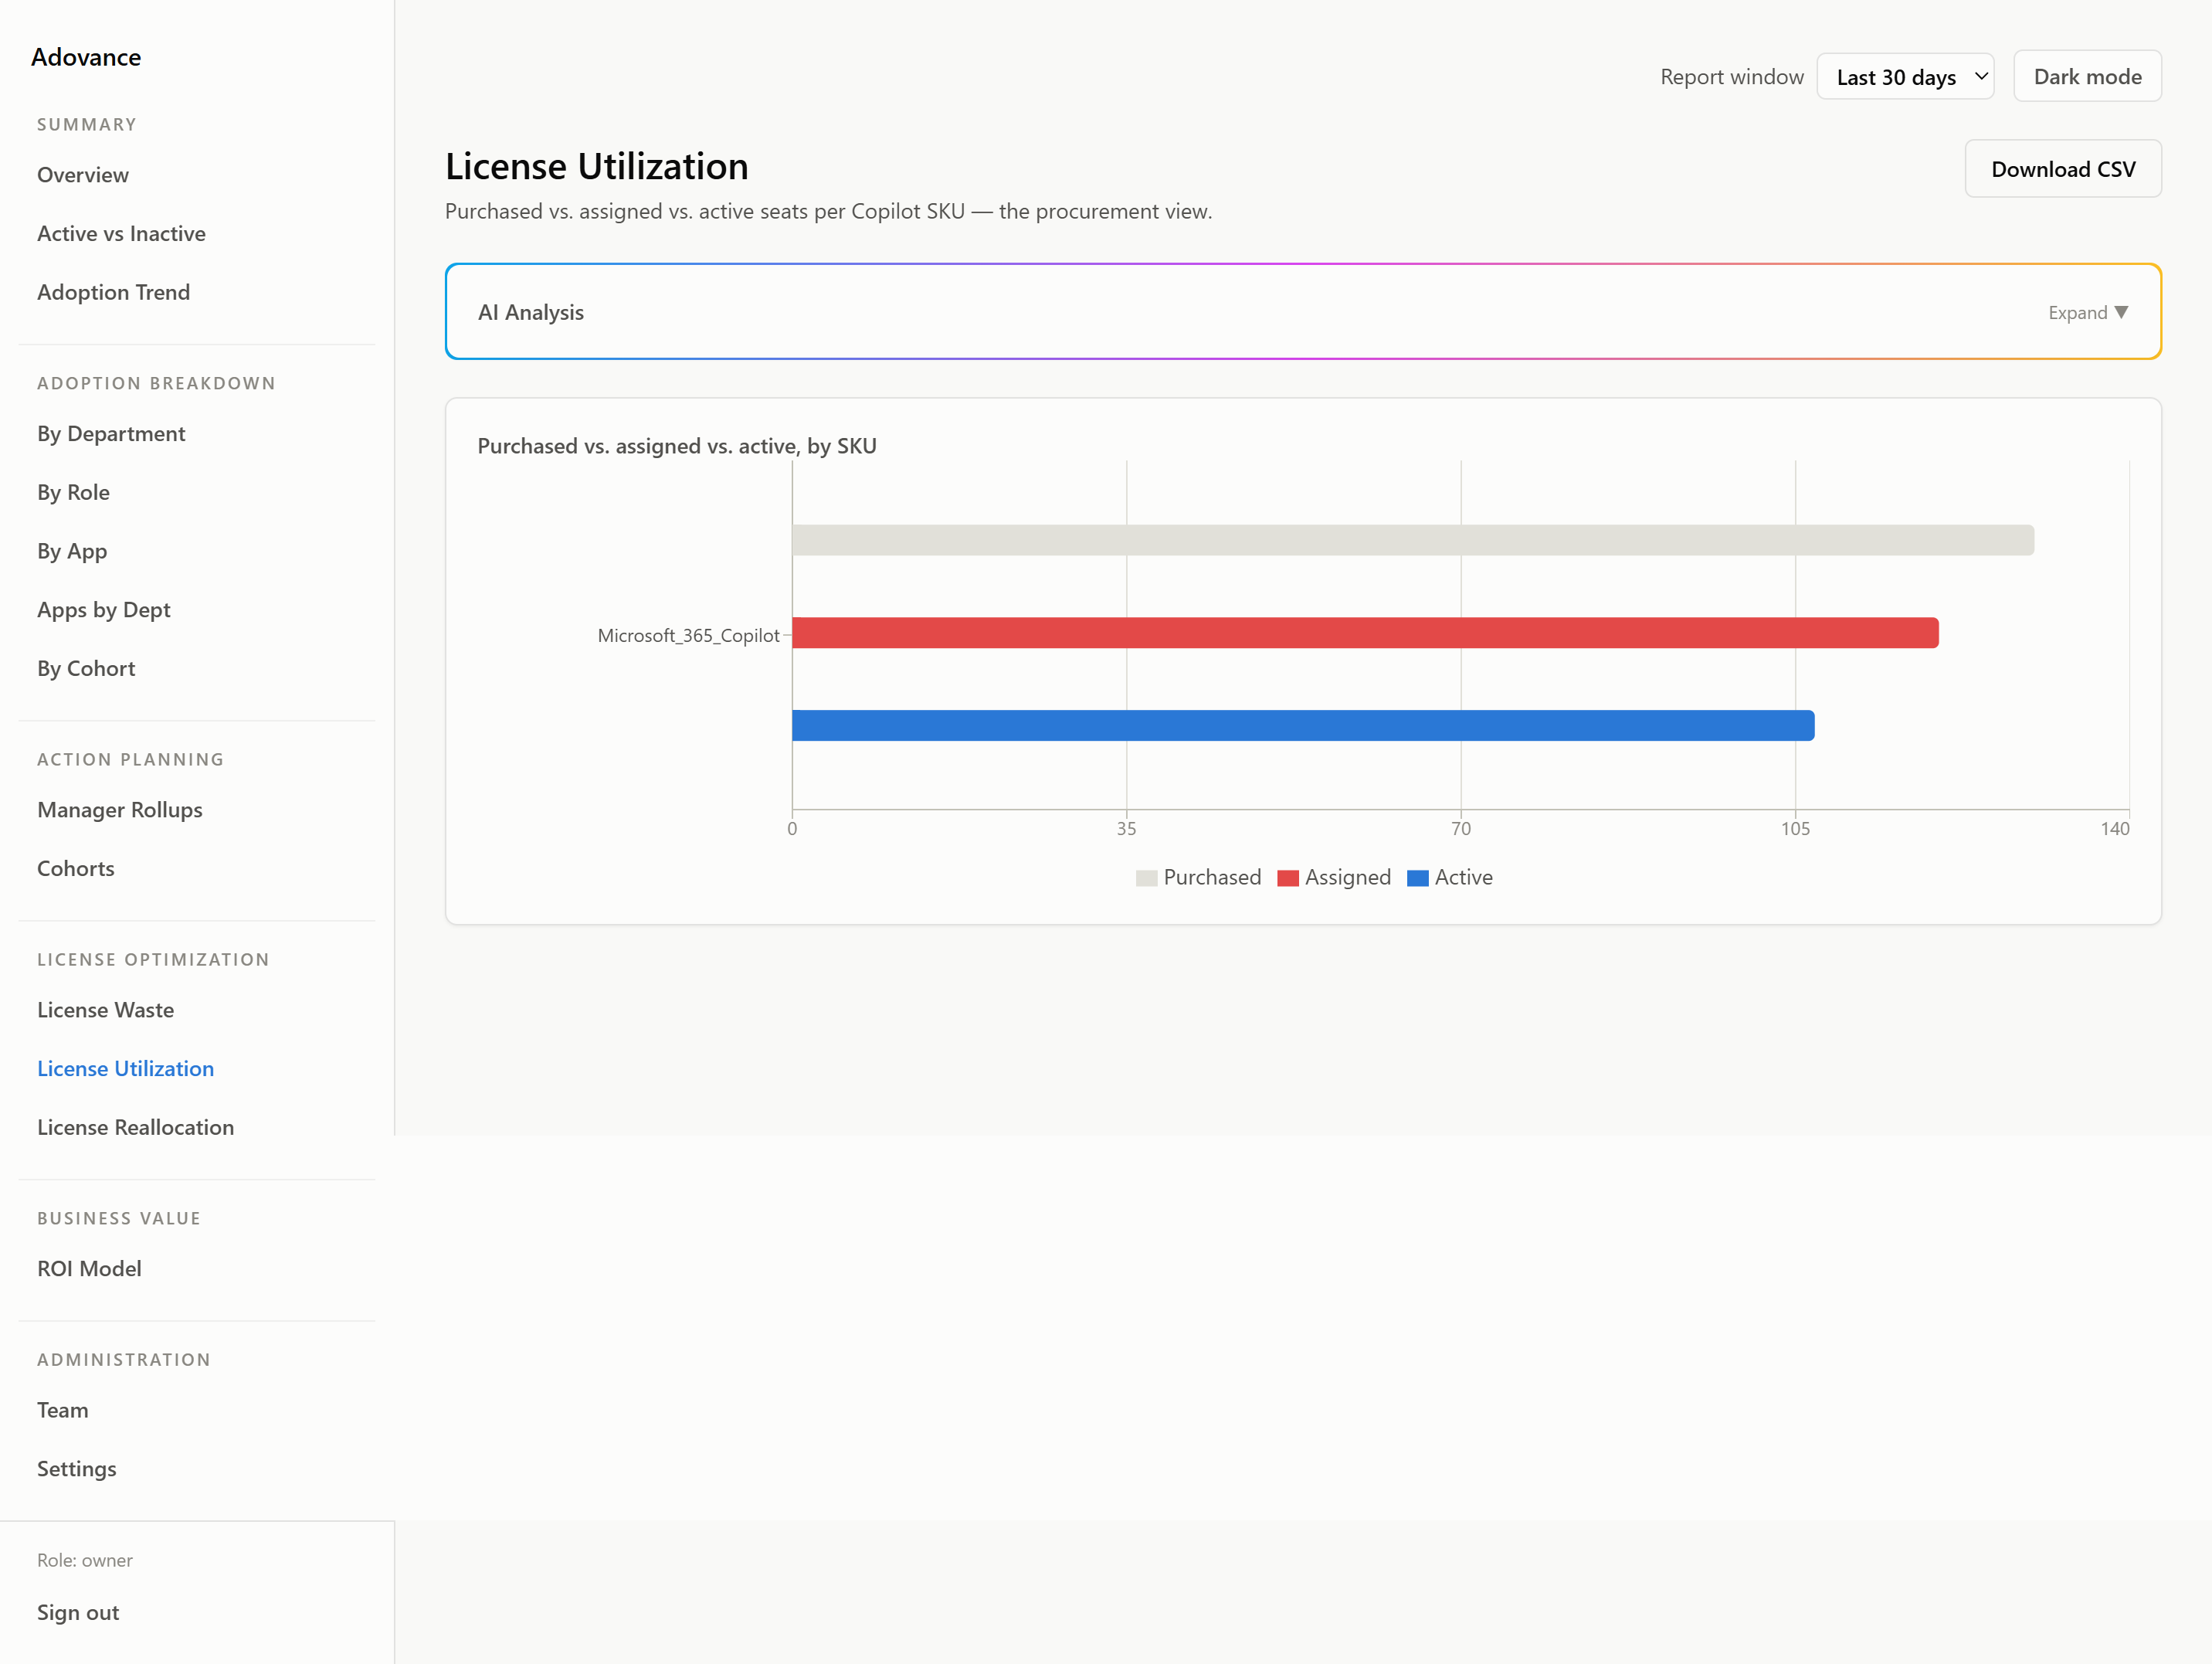
Use it to: right-size renewals.
ROI Model
A defensible ROI model tying active usage to productivity value vs. license cost, driven by your economics. Charts ROI/value over time from saved snapshots rather than a single live number.
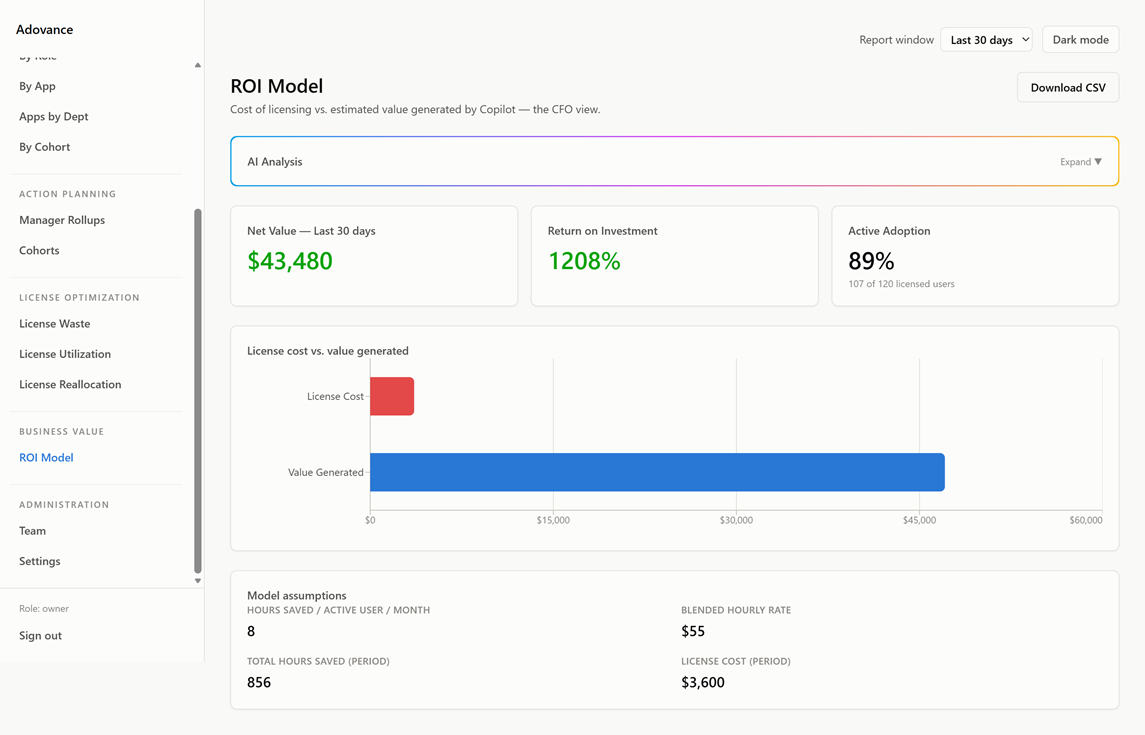
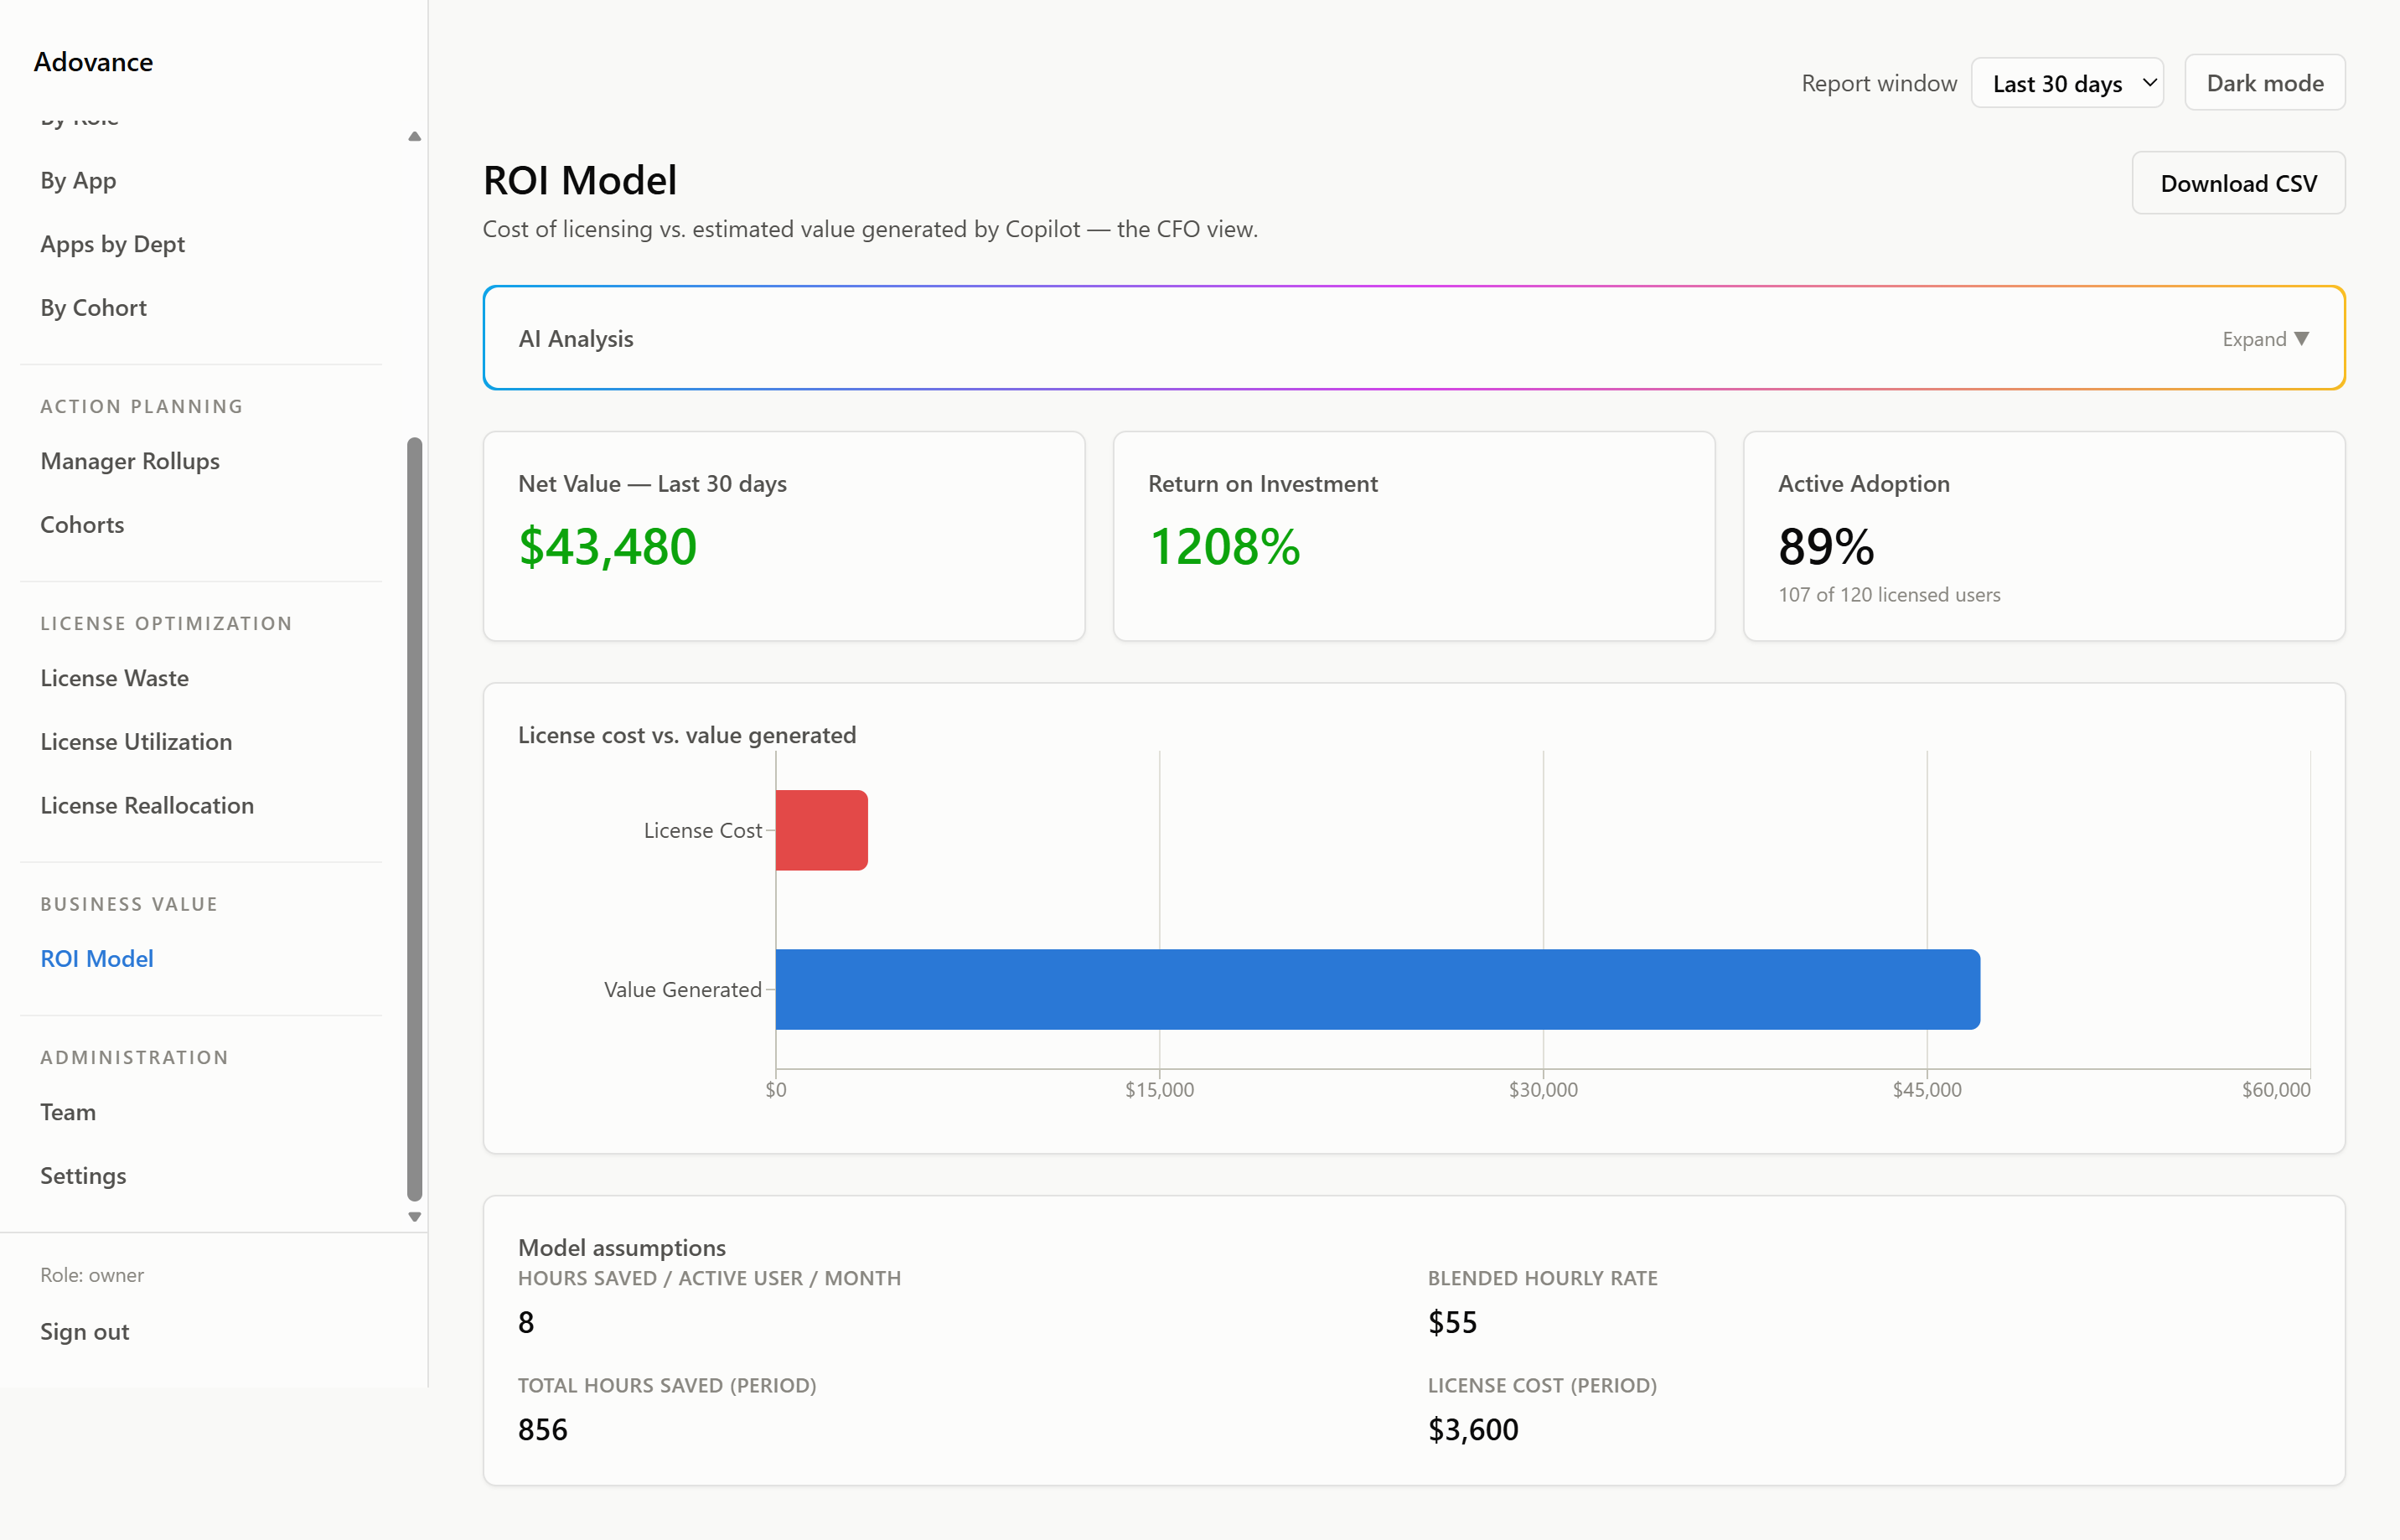
Use it to: prove Copilot is paying for itself at renewal time.