
Quick Start Guide
Get from connecting your tenant to your first executive report in a few minutes of setup (plus one data sync).
Before you begin
You’ll need:
- ✅ A Microsoft 365 Global Administrator to grant admin consent (one time only)
- ✅ At least one Microsoft 365 Copilot license in your tenant
- ✅ The economics you want to report on (license cost, blended hourly rate) - optional, defaults are provided
💡 No per-user rollout required. Adovance works at the tenant level. There are no agents to deploy and nothing for end users to install.
Step 1 - Connect your tenant
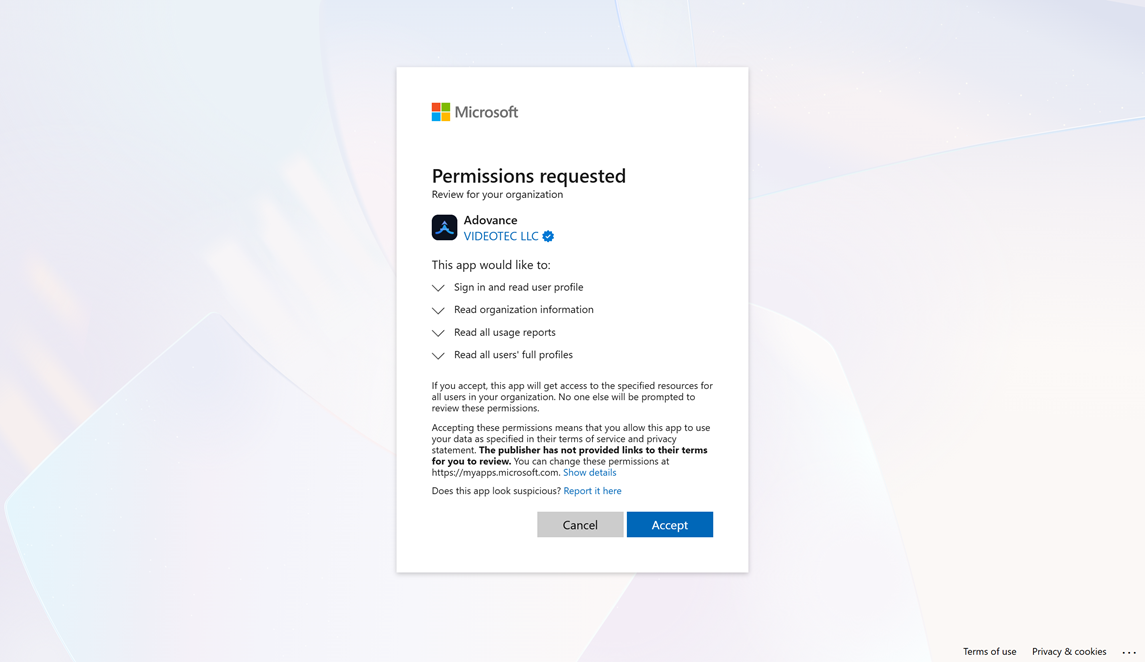
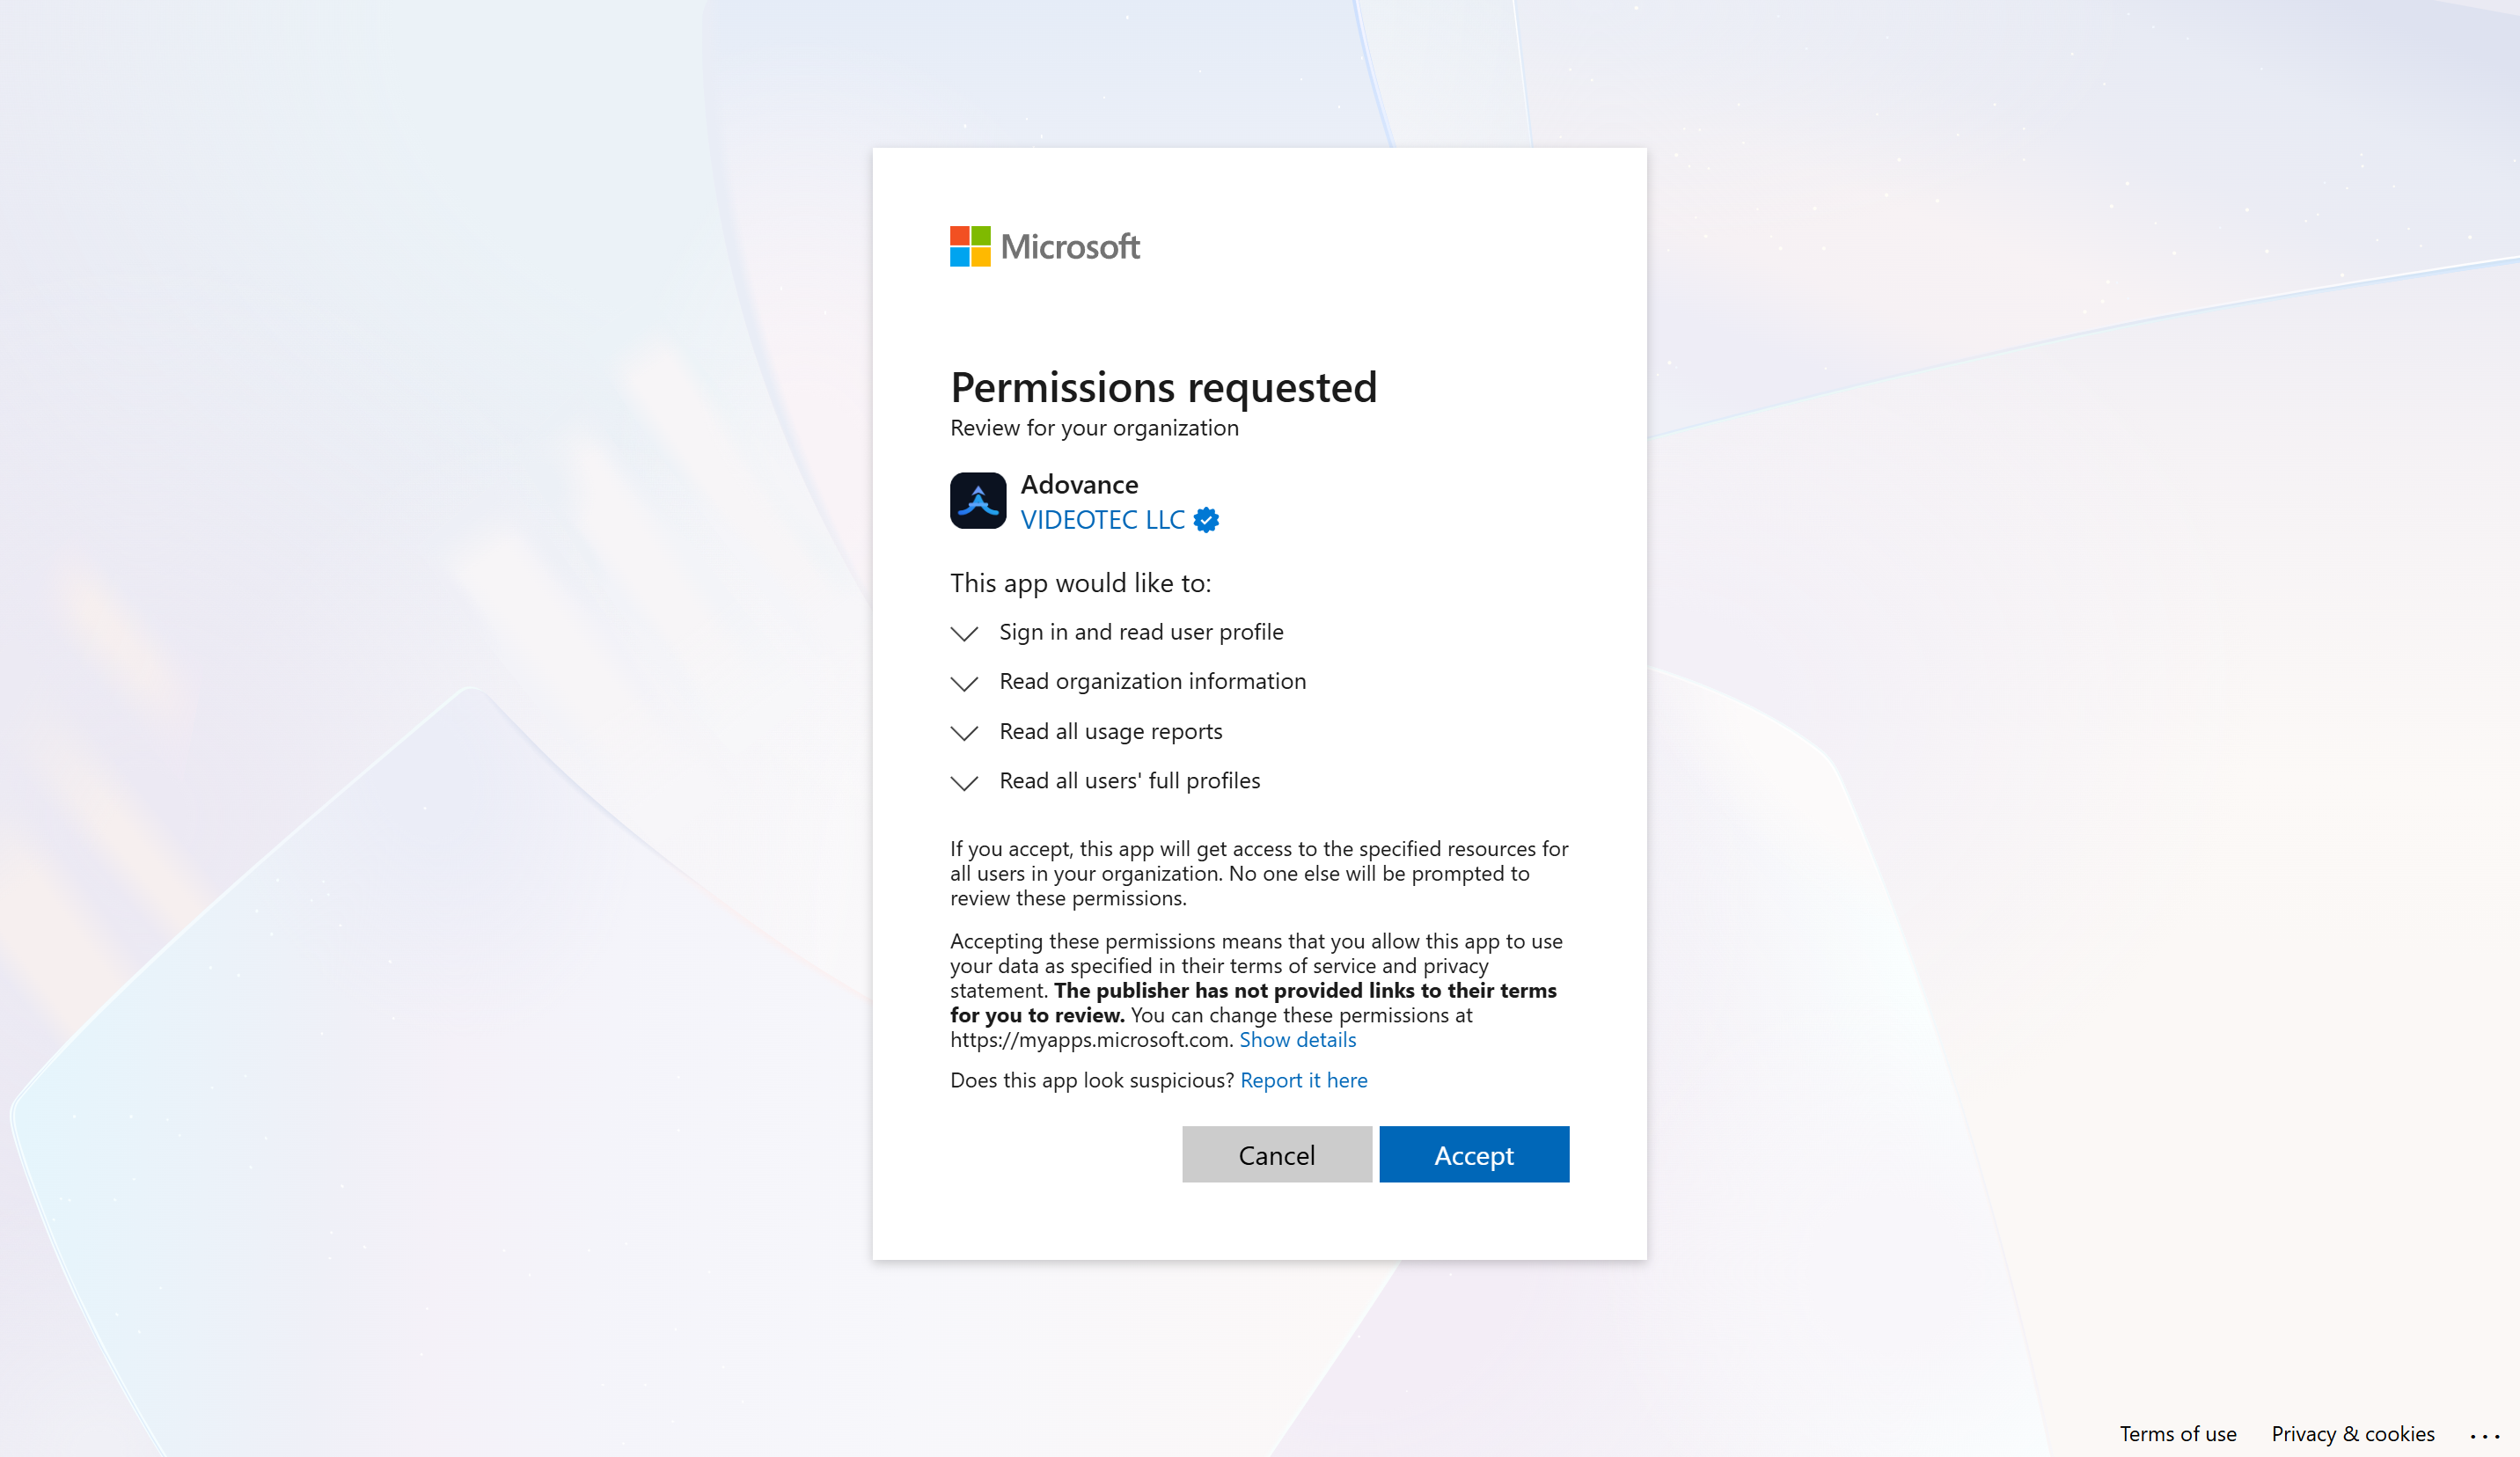
Your Global Administrator grants admin consent once. This authorizes Adovance to read Copilot usage data from Microsoft Graph.
📖 Full instructions: Installation & Onboarding
Step 2 - Turn off concealed user names
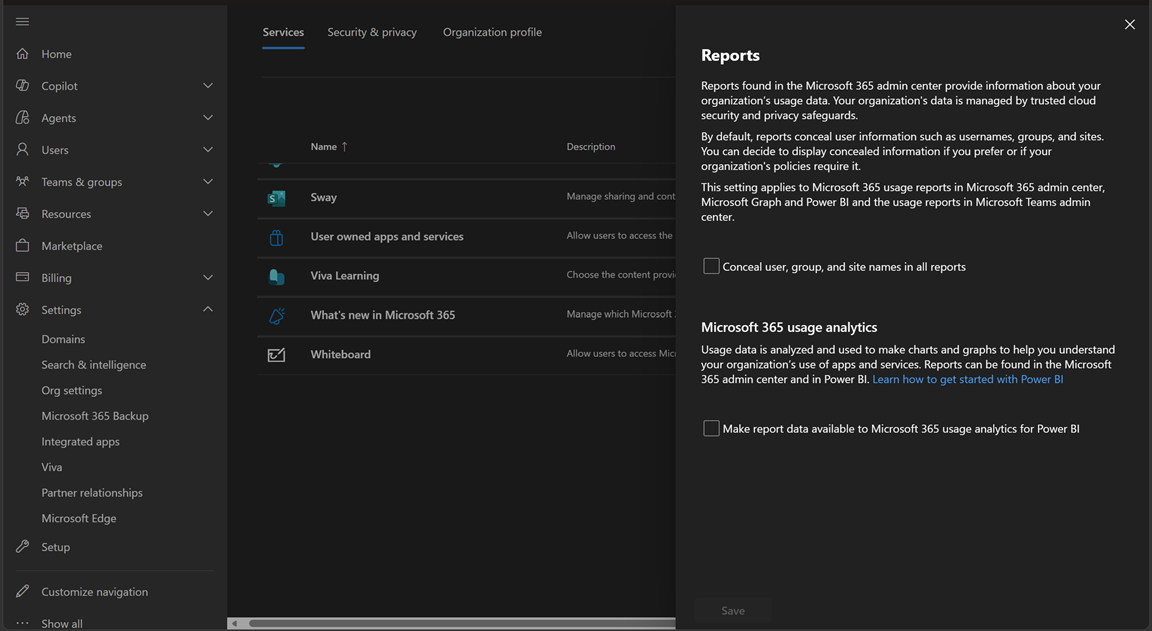
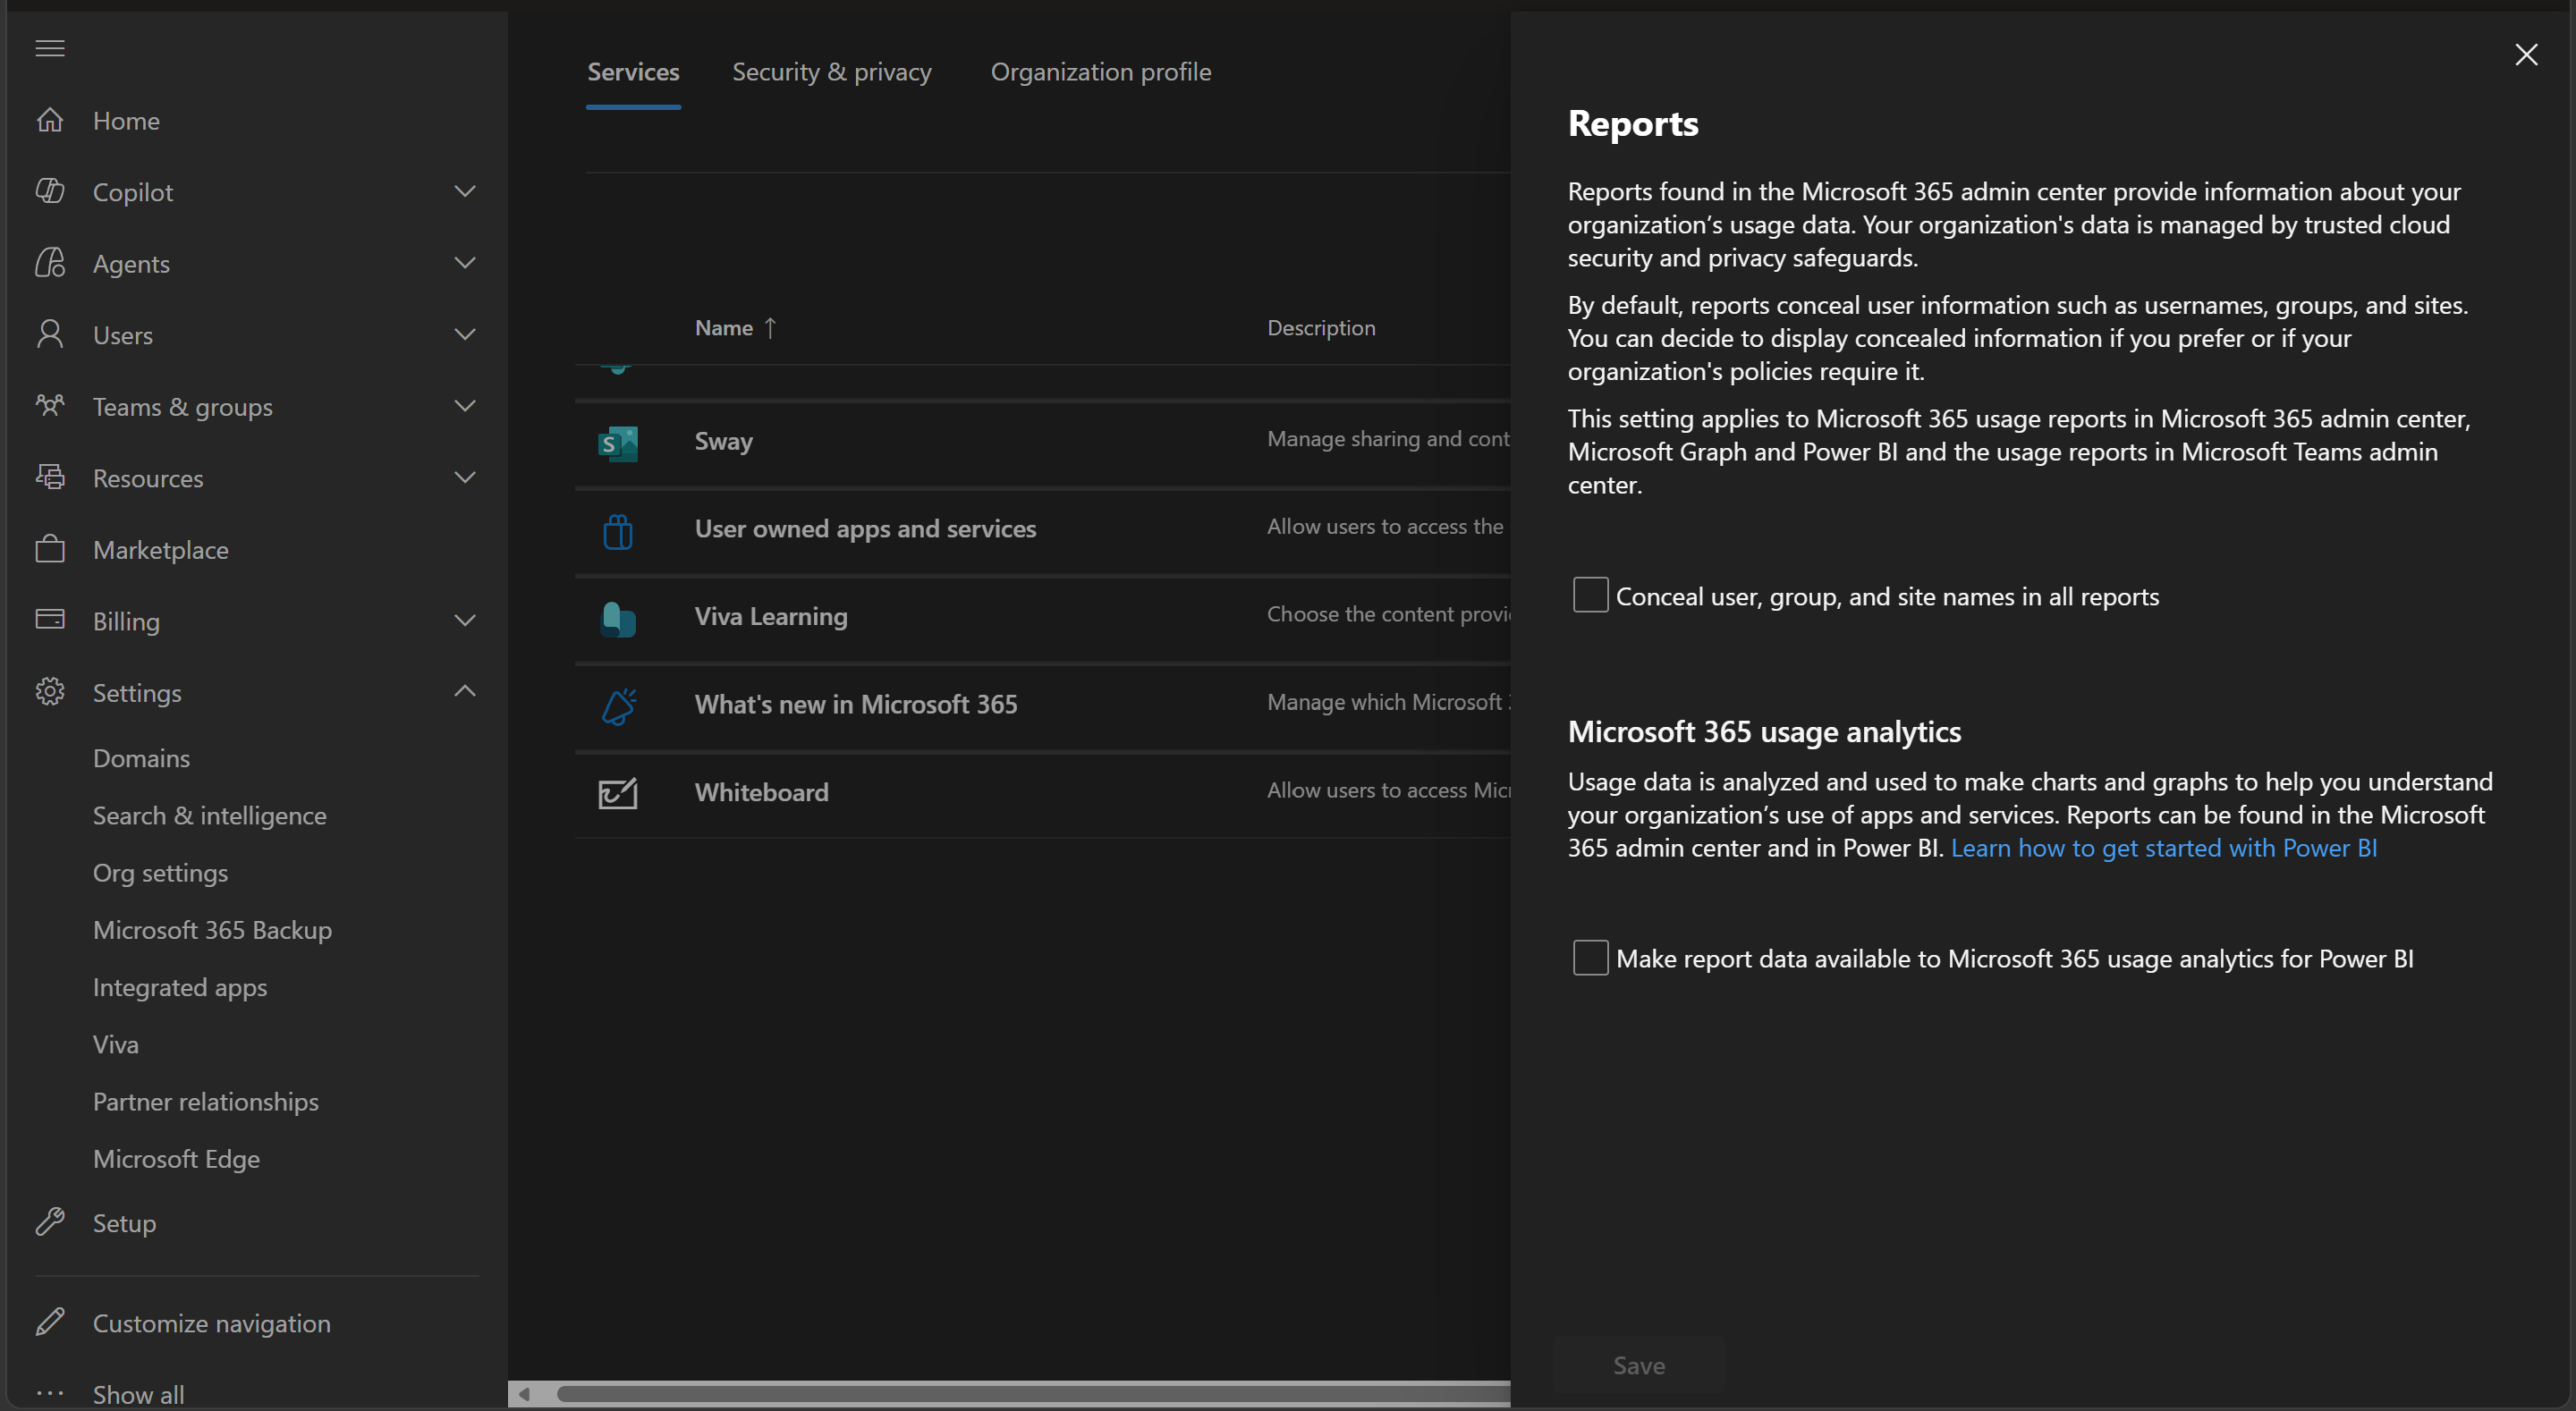
By default, Microsoft conceals user, group, and site names in all usage reports - which silently makes every user look inactive. Your Global Administrator must turn this setting off for Adovance to report accurately.
M365 Admin Center → Settings → Org settings → Reports → uncheck “Display concealed user, group, and site names in all reports”.
📖 Why this matters: Data Quality & the Concealed-Names Trap
Step 3 - Sign in to the dashboard
- Go to your Adovance dashboard URL
- Click Sign in with Microsoft
- Approve the standard sign-in prompt
📖 Read more: Signing In
Step 4 - Wait for the first sync
Adovance syncs Copilot usage from Microsoft Graph. The first sync backfills roughly six months of adoption-trend history so your charts aren’t empty on day one.
⏱️ If your dashboard looks empty right after onboarding, the first sync may still be running. Give it a few minutes and refresh.
Step 5 - Review the Overview
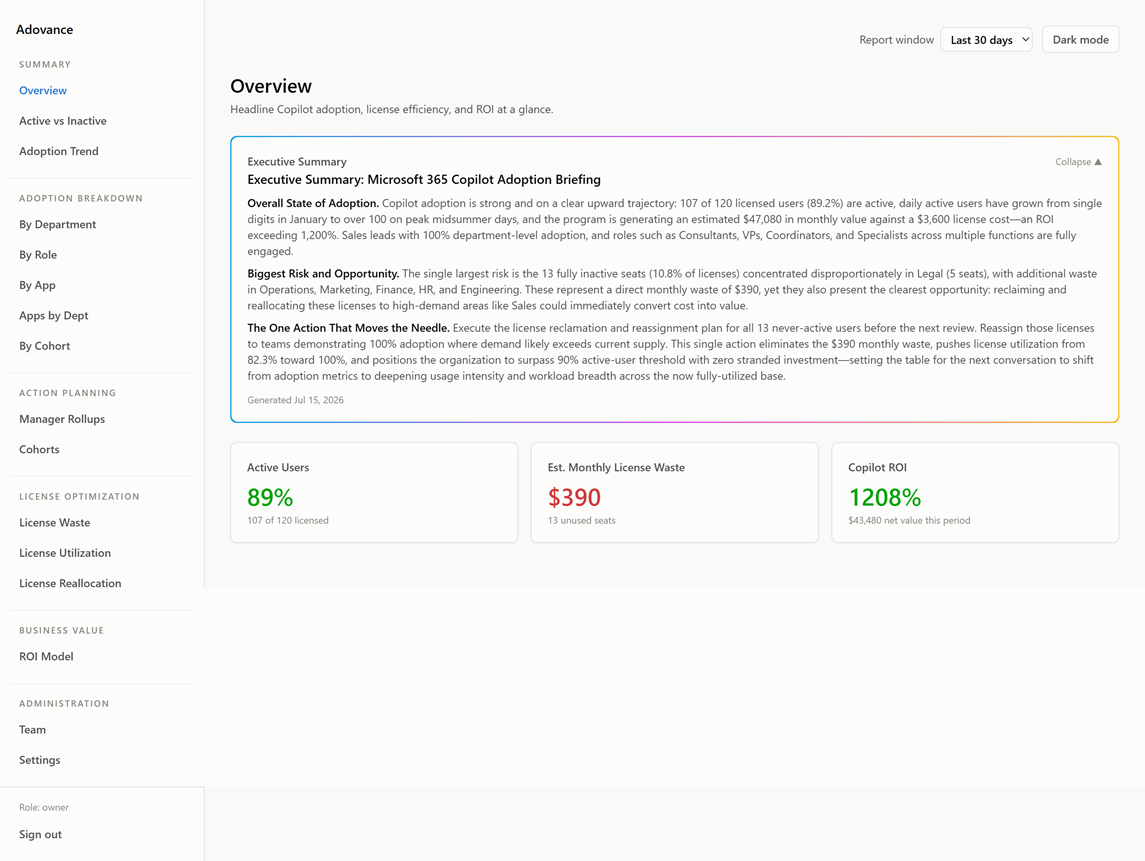
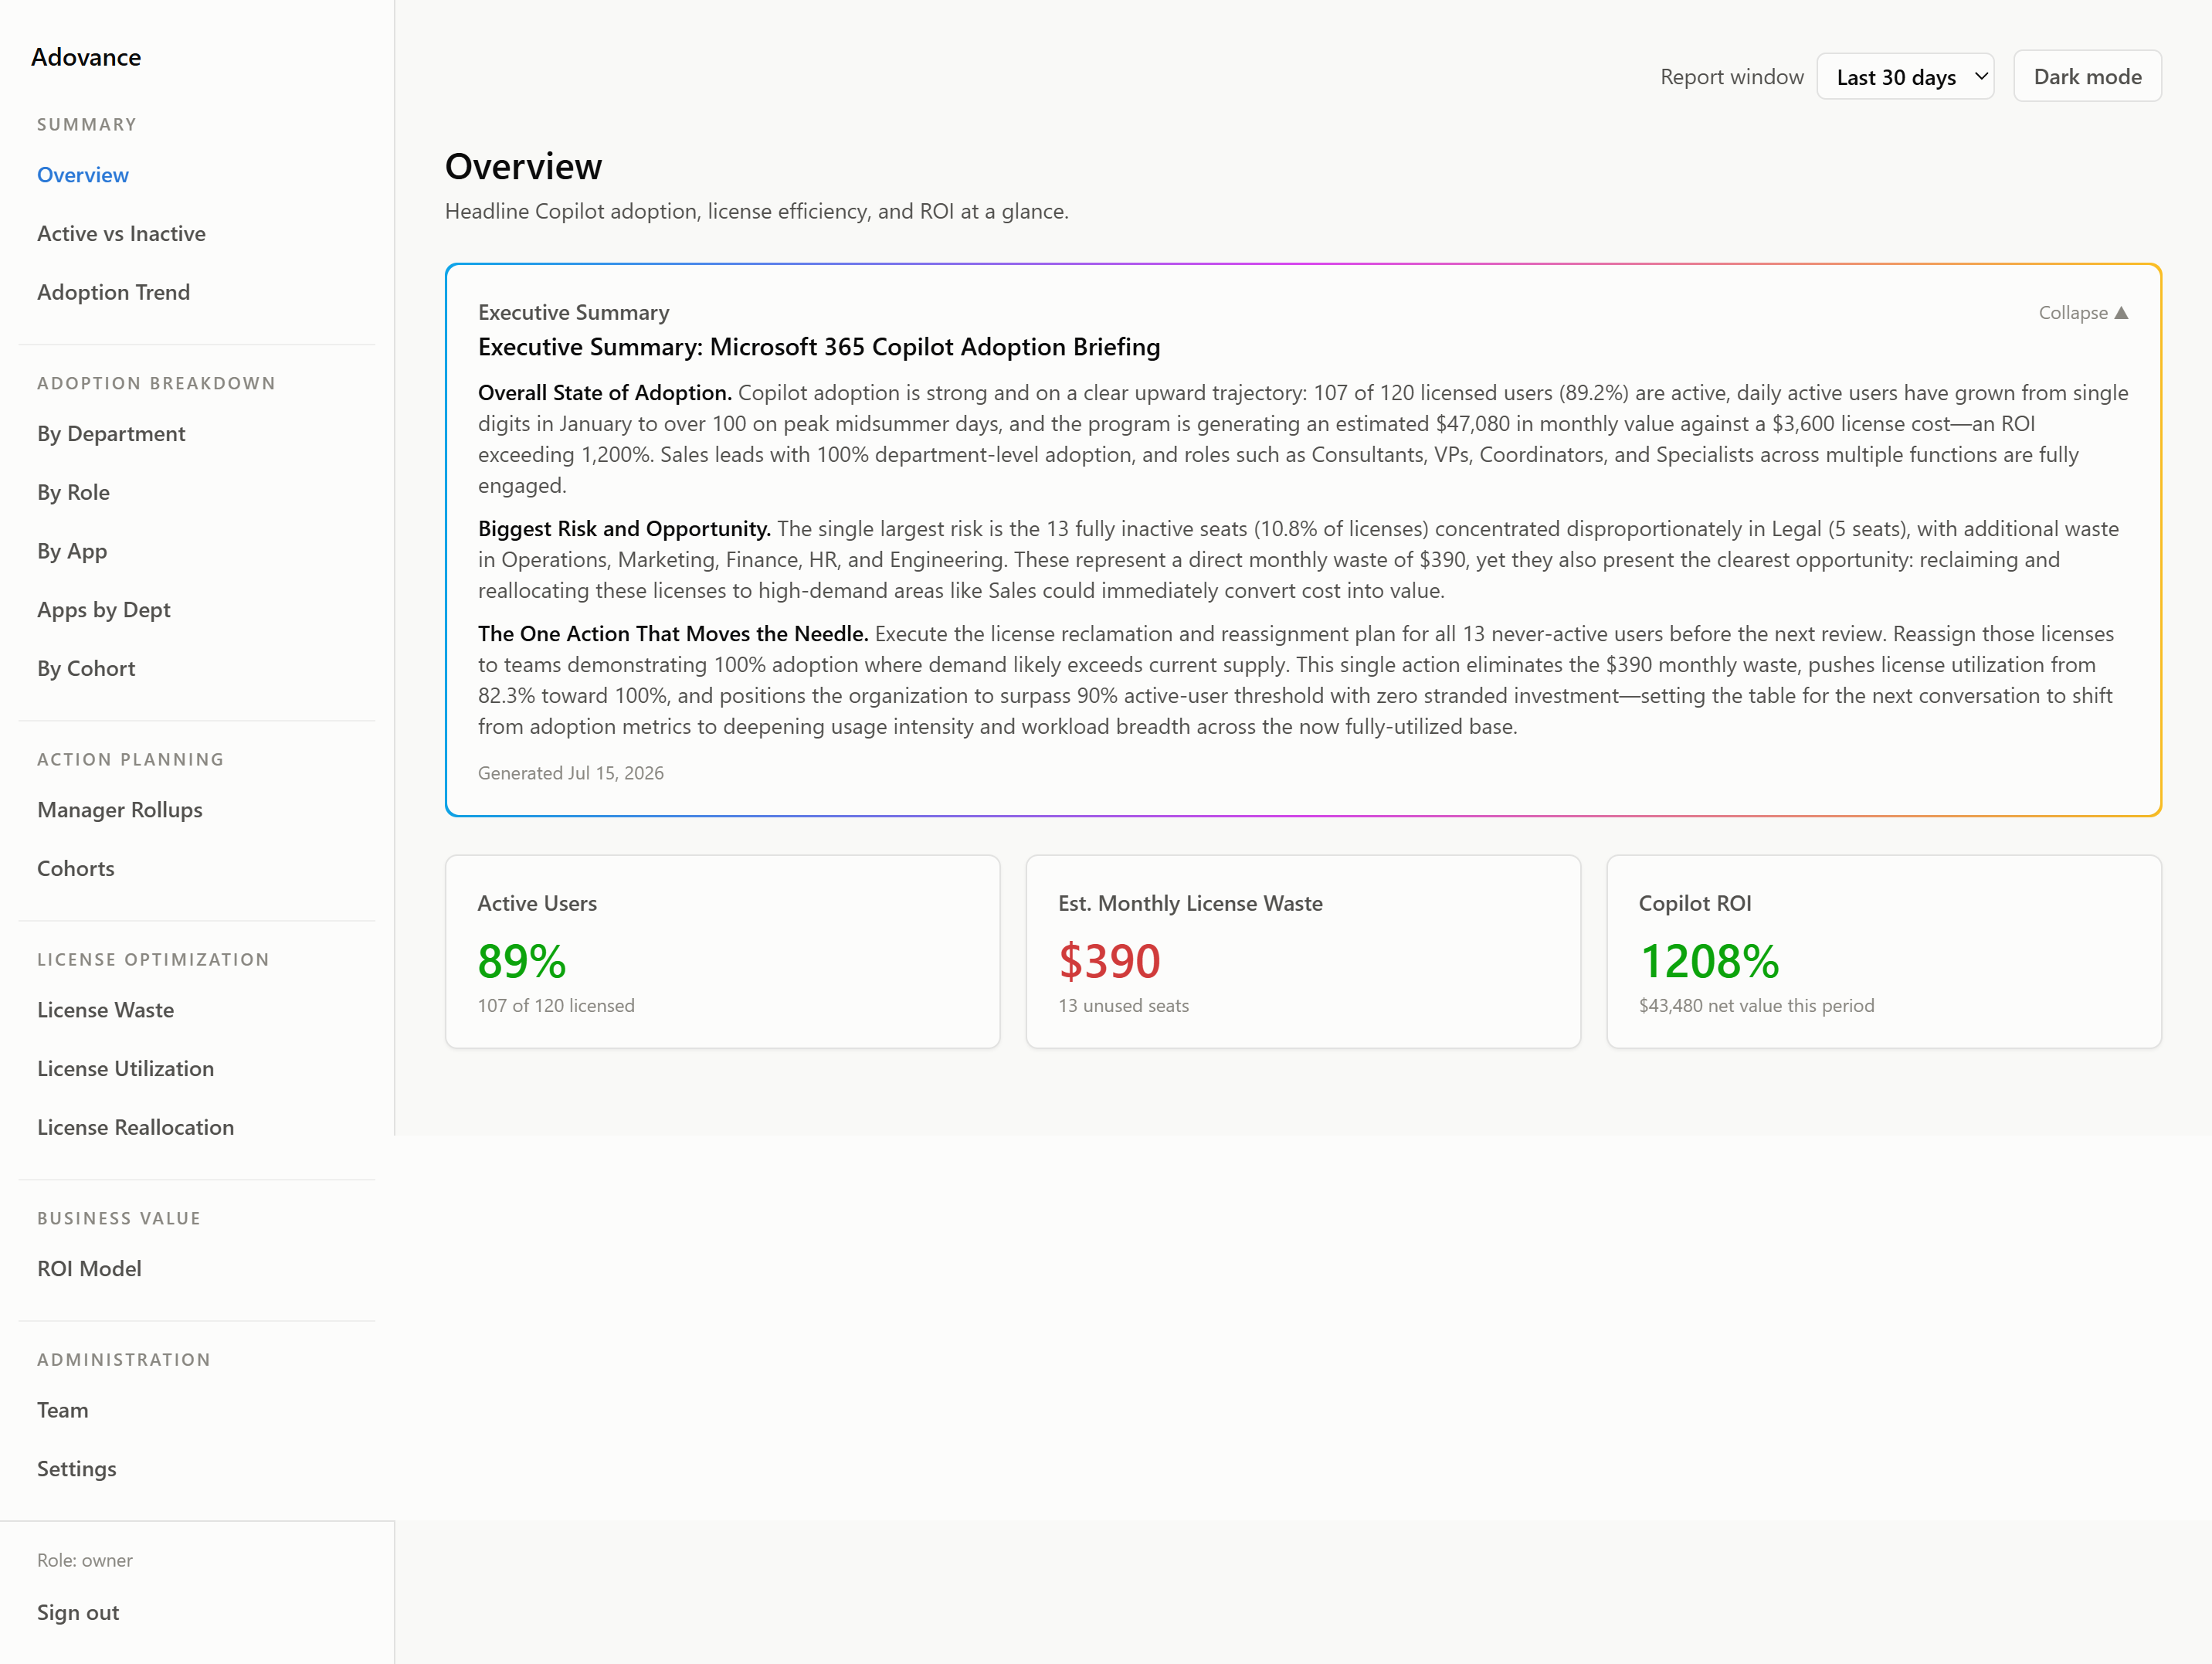
The Overview page leads with an AI Executive Summary that synthesizes every report into a single narrative, plus your headline numbers: active %, license waste, and ROI.
📖 Read more: Understanding Your Reports
Step 6 - Set your economics
Open Settings and set your real license cost, blended hourly rate, and inactivity threshold. The defaults are placeholders - the License Waste, Reallocation, and ROI reports become accurate once these reflect your numbers.
📖 Read more: Settings & Your Economics
Step 7 - Export for your board deck
Every report has a Download CSV button. Use the exports in Power BI, Excel, or straight into a slide.
📖 Read more: Exporting Data
What’s next?
- 🧭 Learn how to move around in Navigating the Dashboard
- 🏷️ Group users with Cohorts & Tagging
- 📧 Turn on Email Digests & Alerts
Still stuck?
- ❓ Check the FAQ
- ✉️ Email us at support@videotec.io