
Navigating the Dashboard
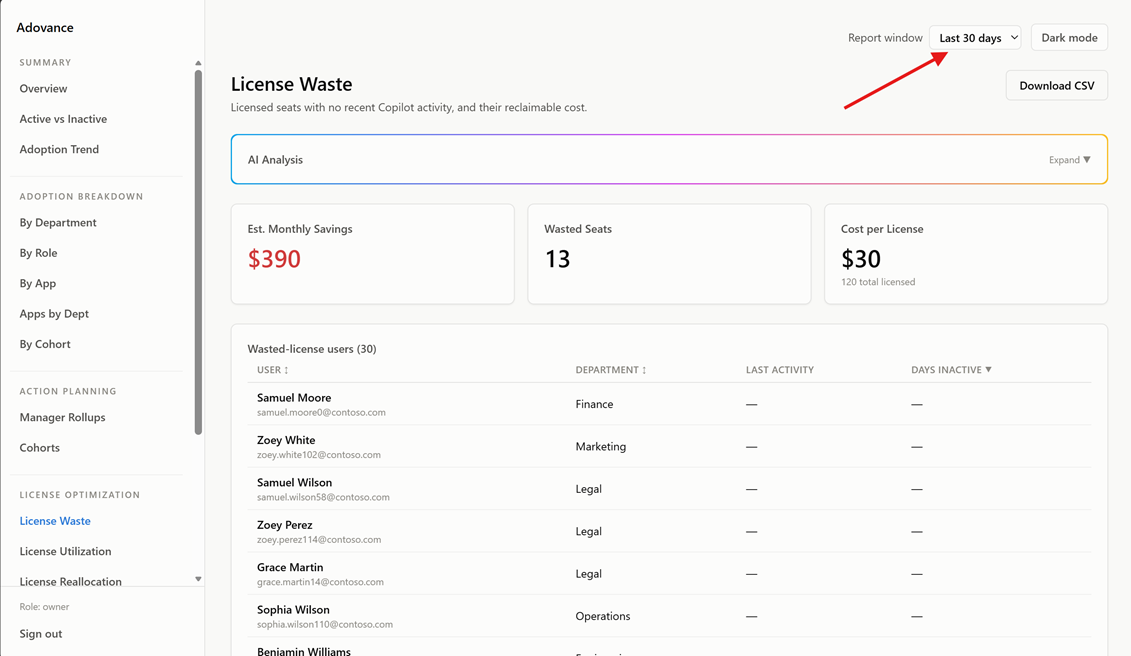
Layout at a glance
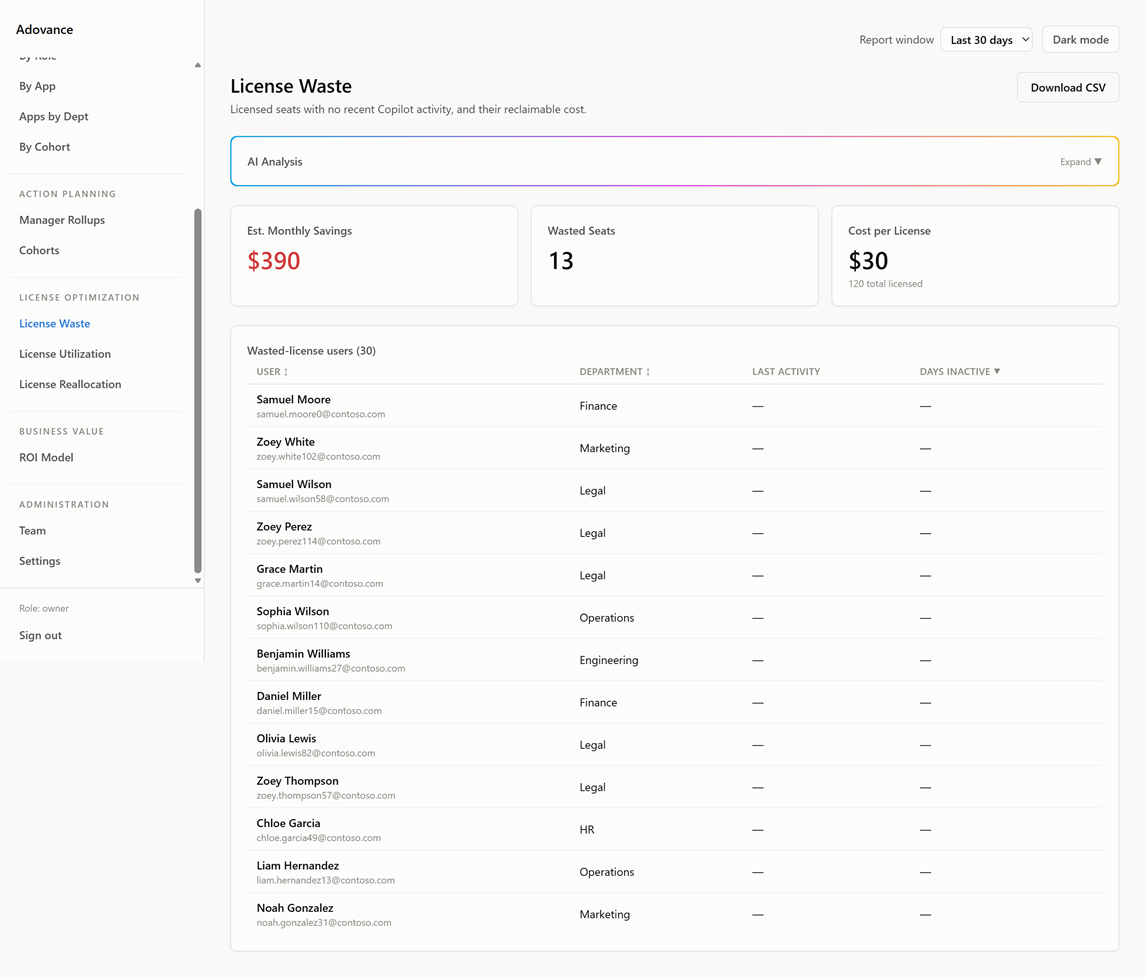
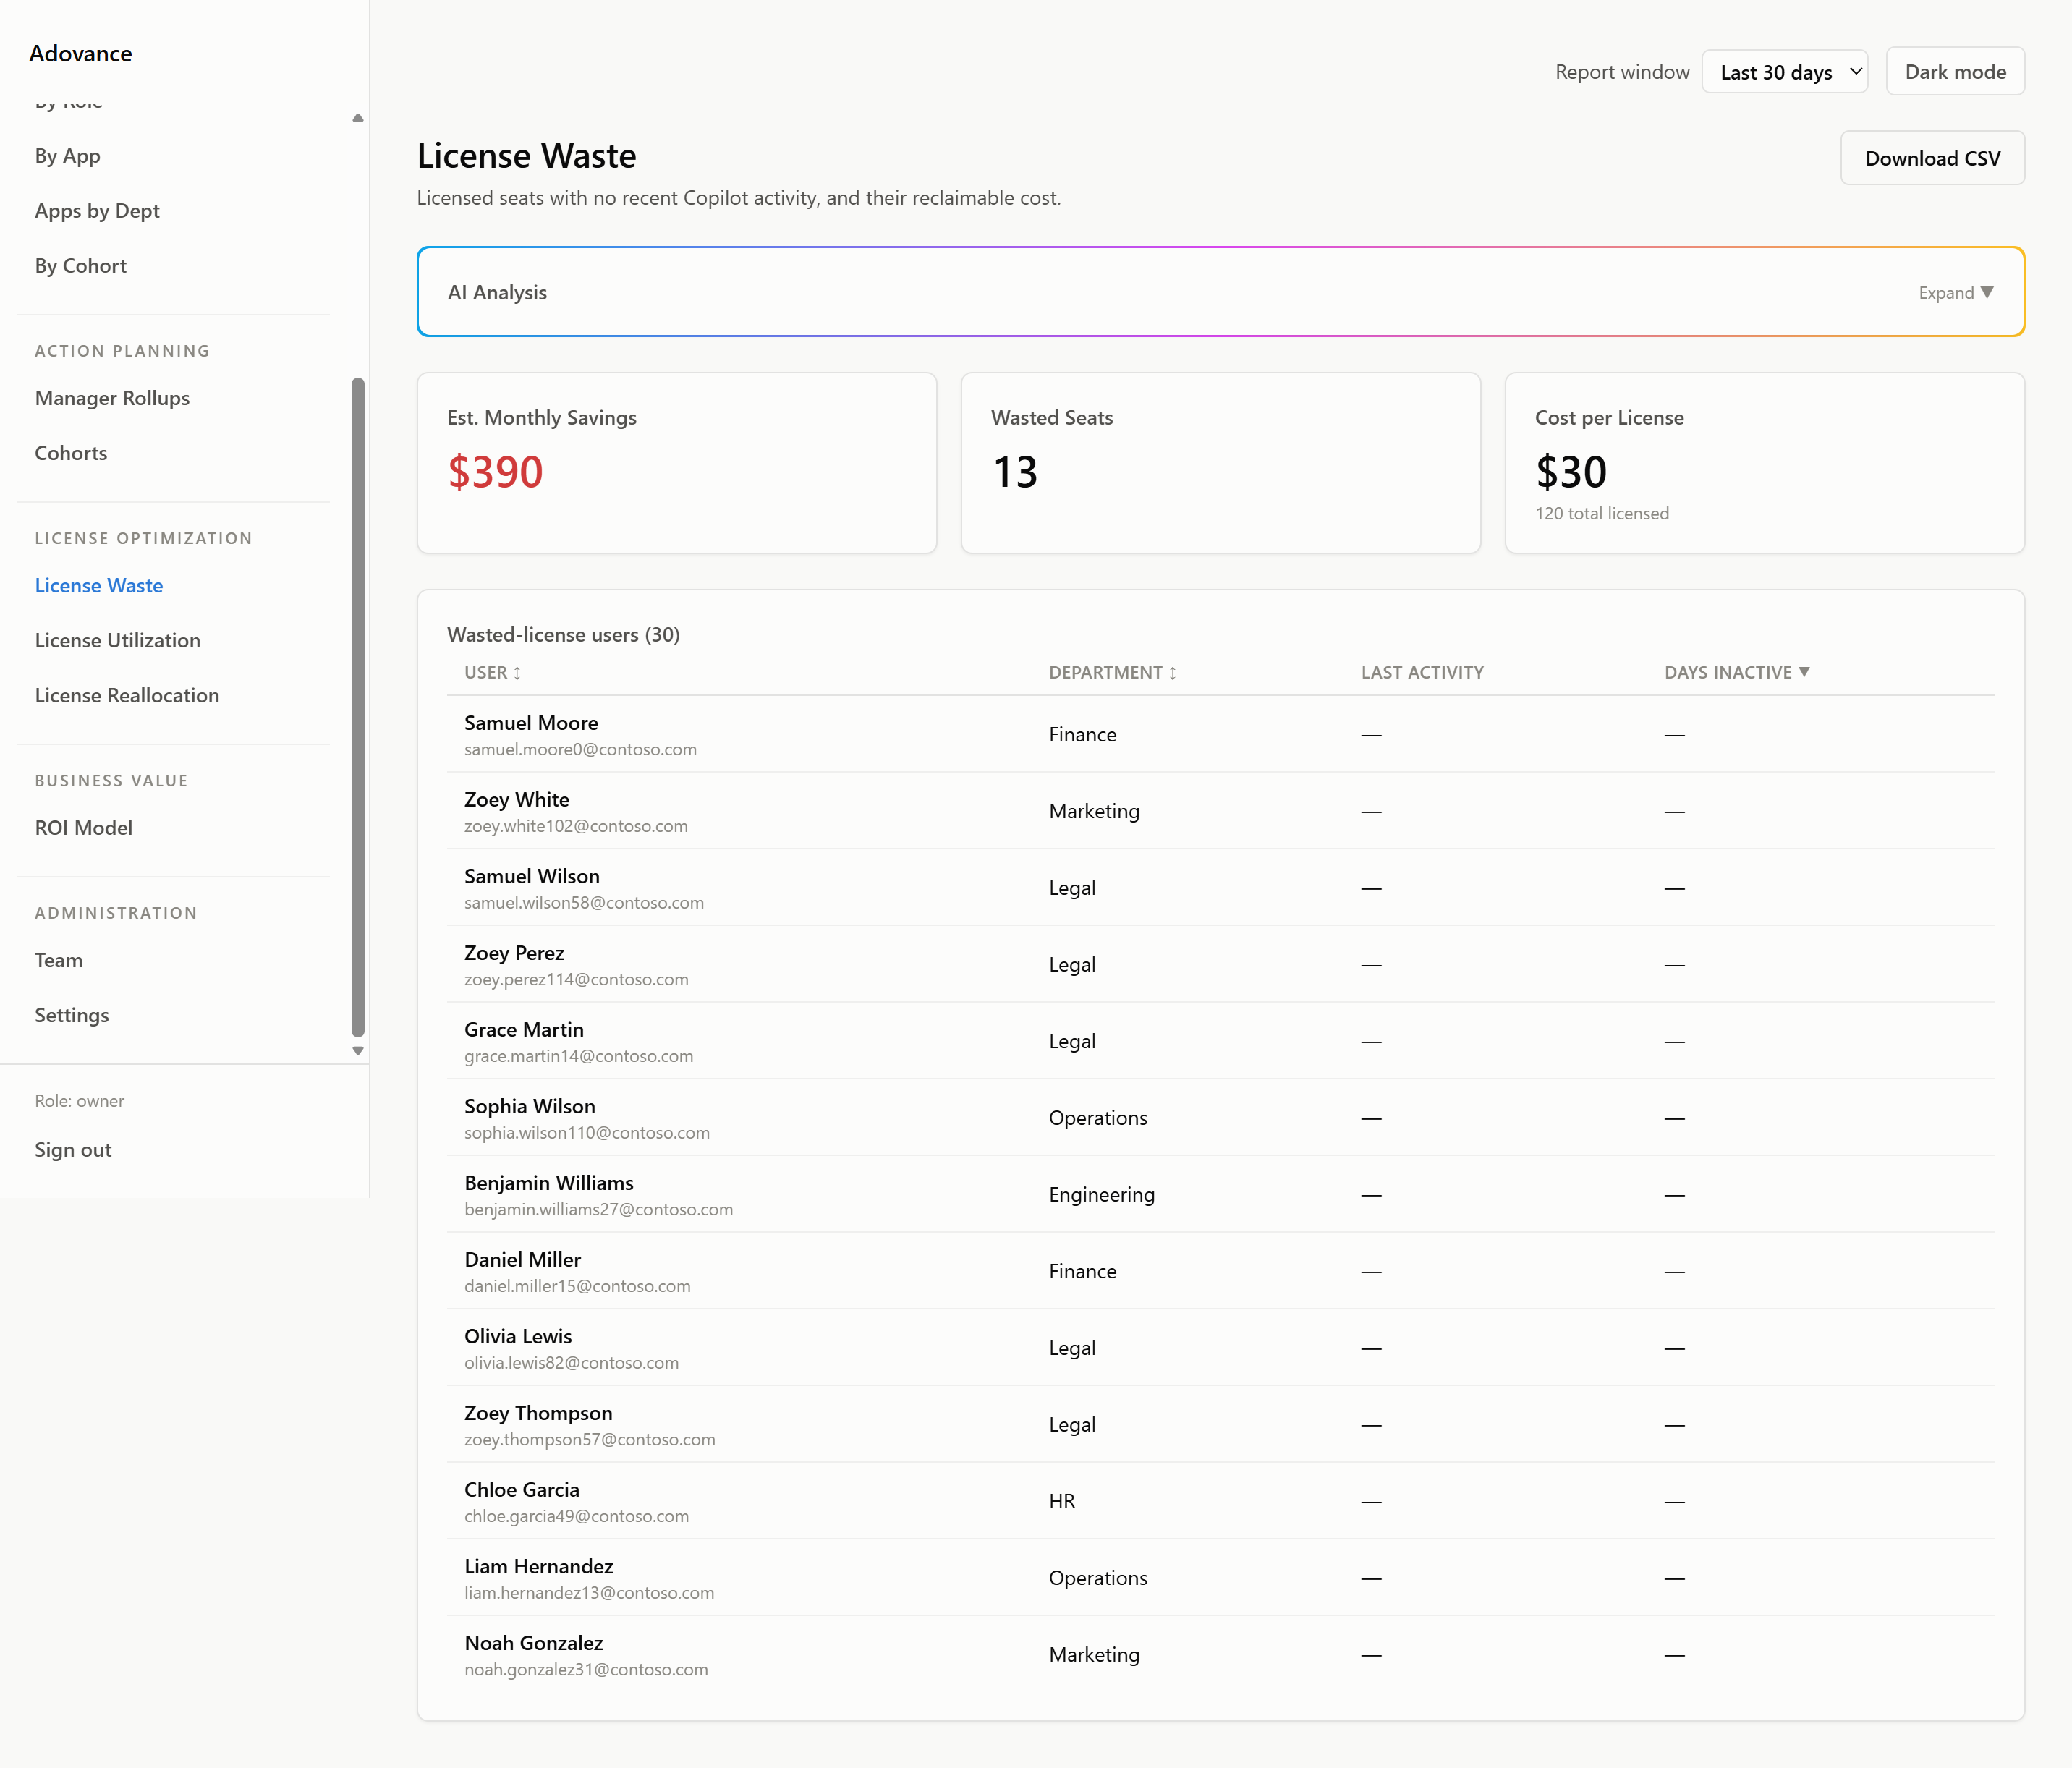
Layout at a glance
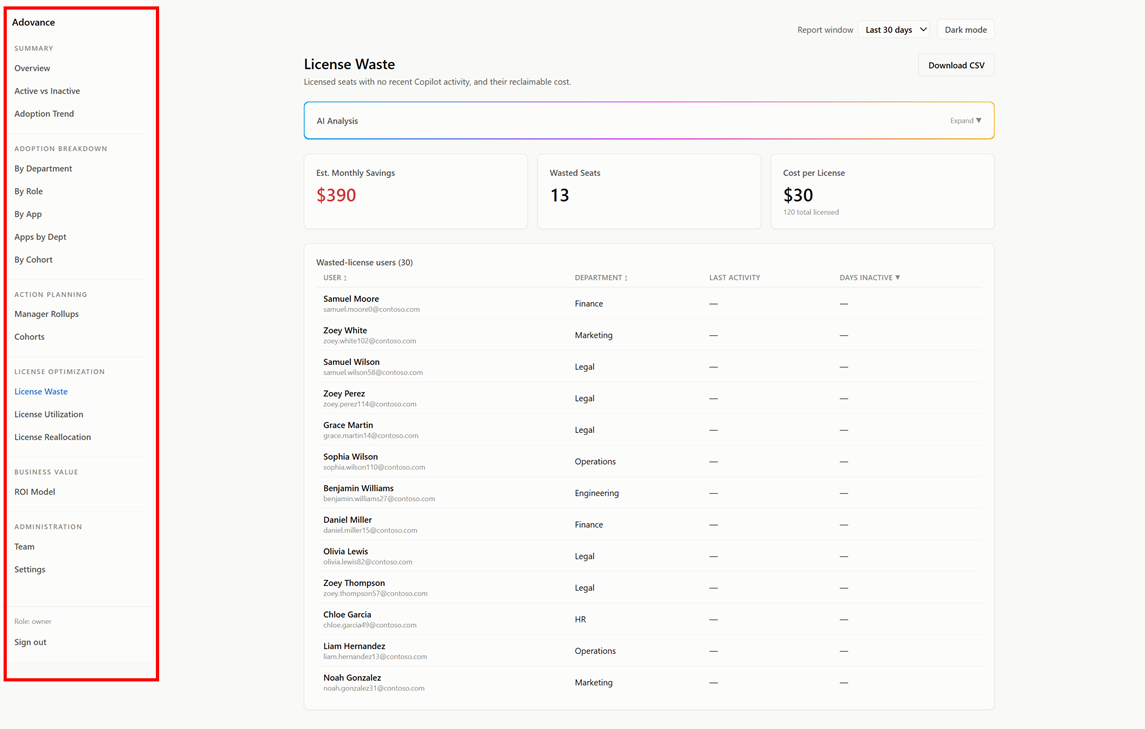
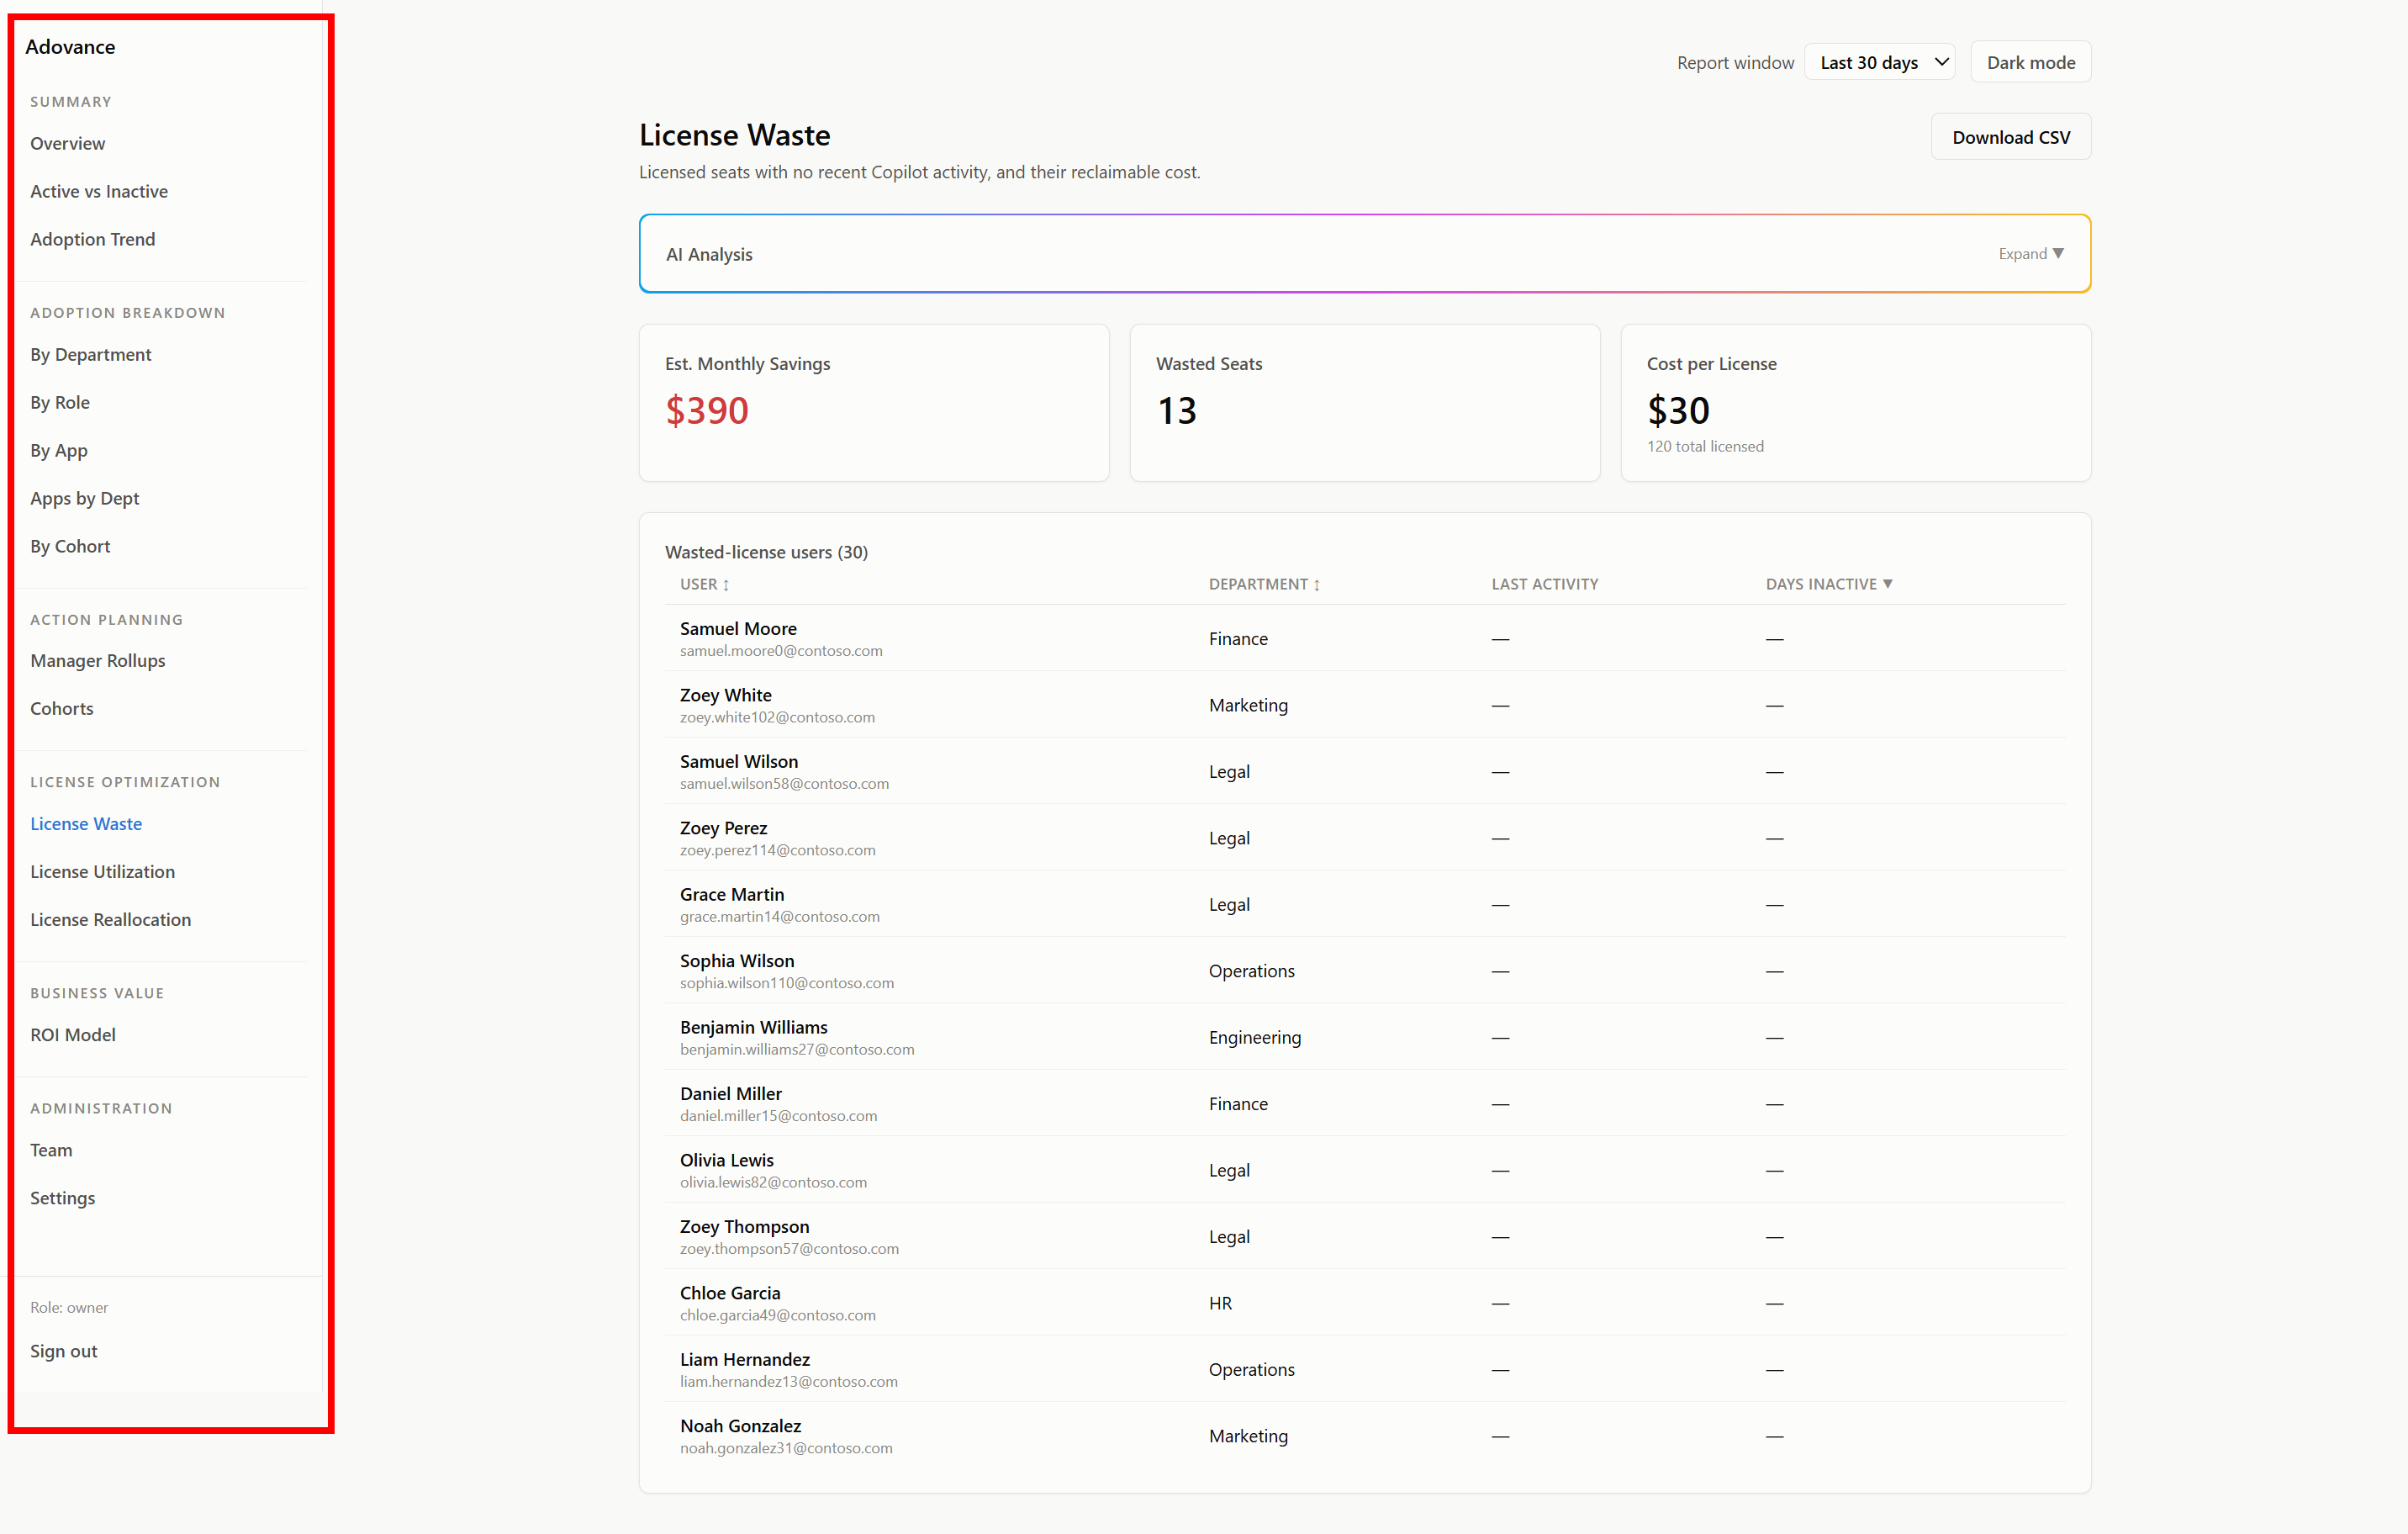
- Left navigation - jump between reports and pages (grouped by theme).
- Report window selector (top-right) - switch between 7 / 30 / 90 day windows.
- Data-quality banner - appears at the top when a sync looks suspiciou.
- Download CSV button - on every report.
The navigation
Reports are grouped so you can move from the big picture down to specifics:
Overview
- Overview - Executive Summary and headline metrics
Adoption
- Active vs Inactive
- Department Adoption
- Role Adoption
- Manager Rollups
- Adoption Trend
- App Adoption
- App Adoption by Department
- Cohort Adoption
License & ROI
Manage
The report window selector
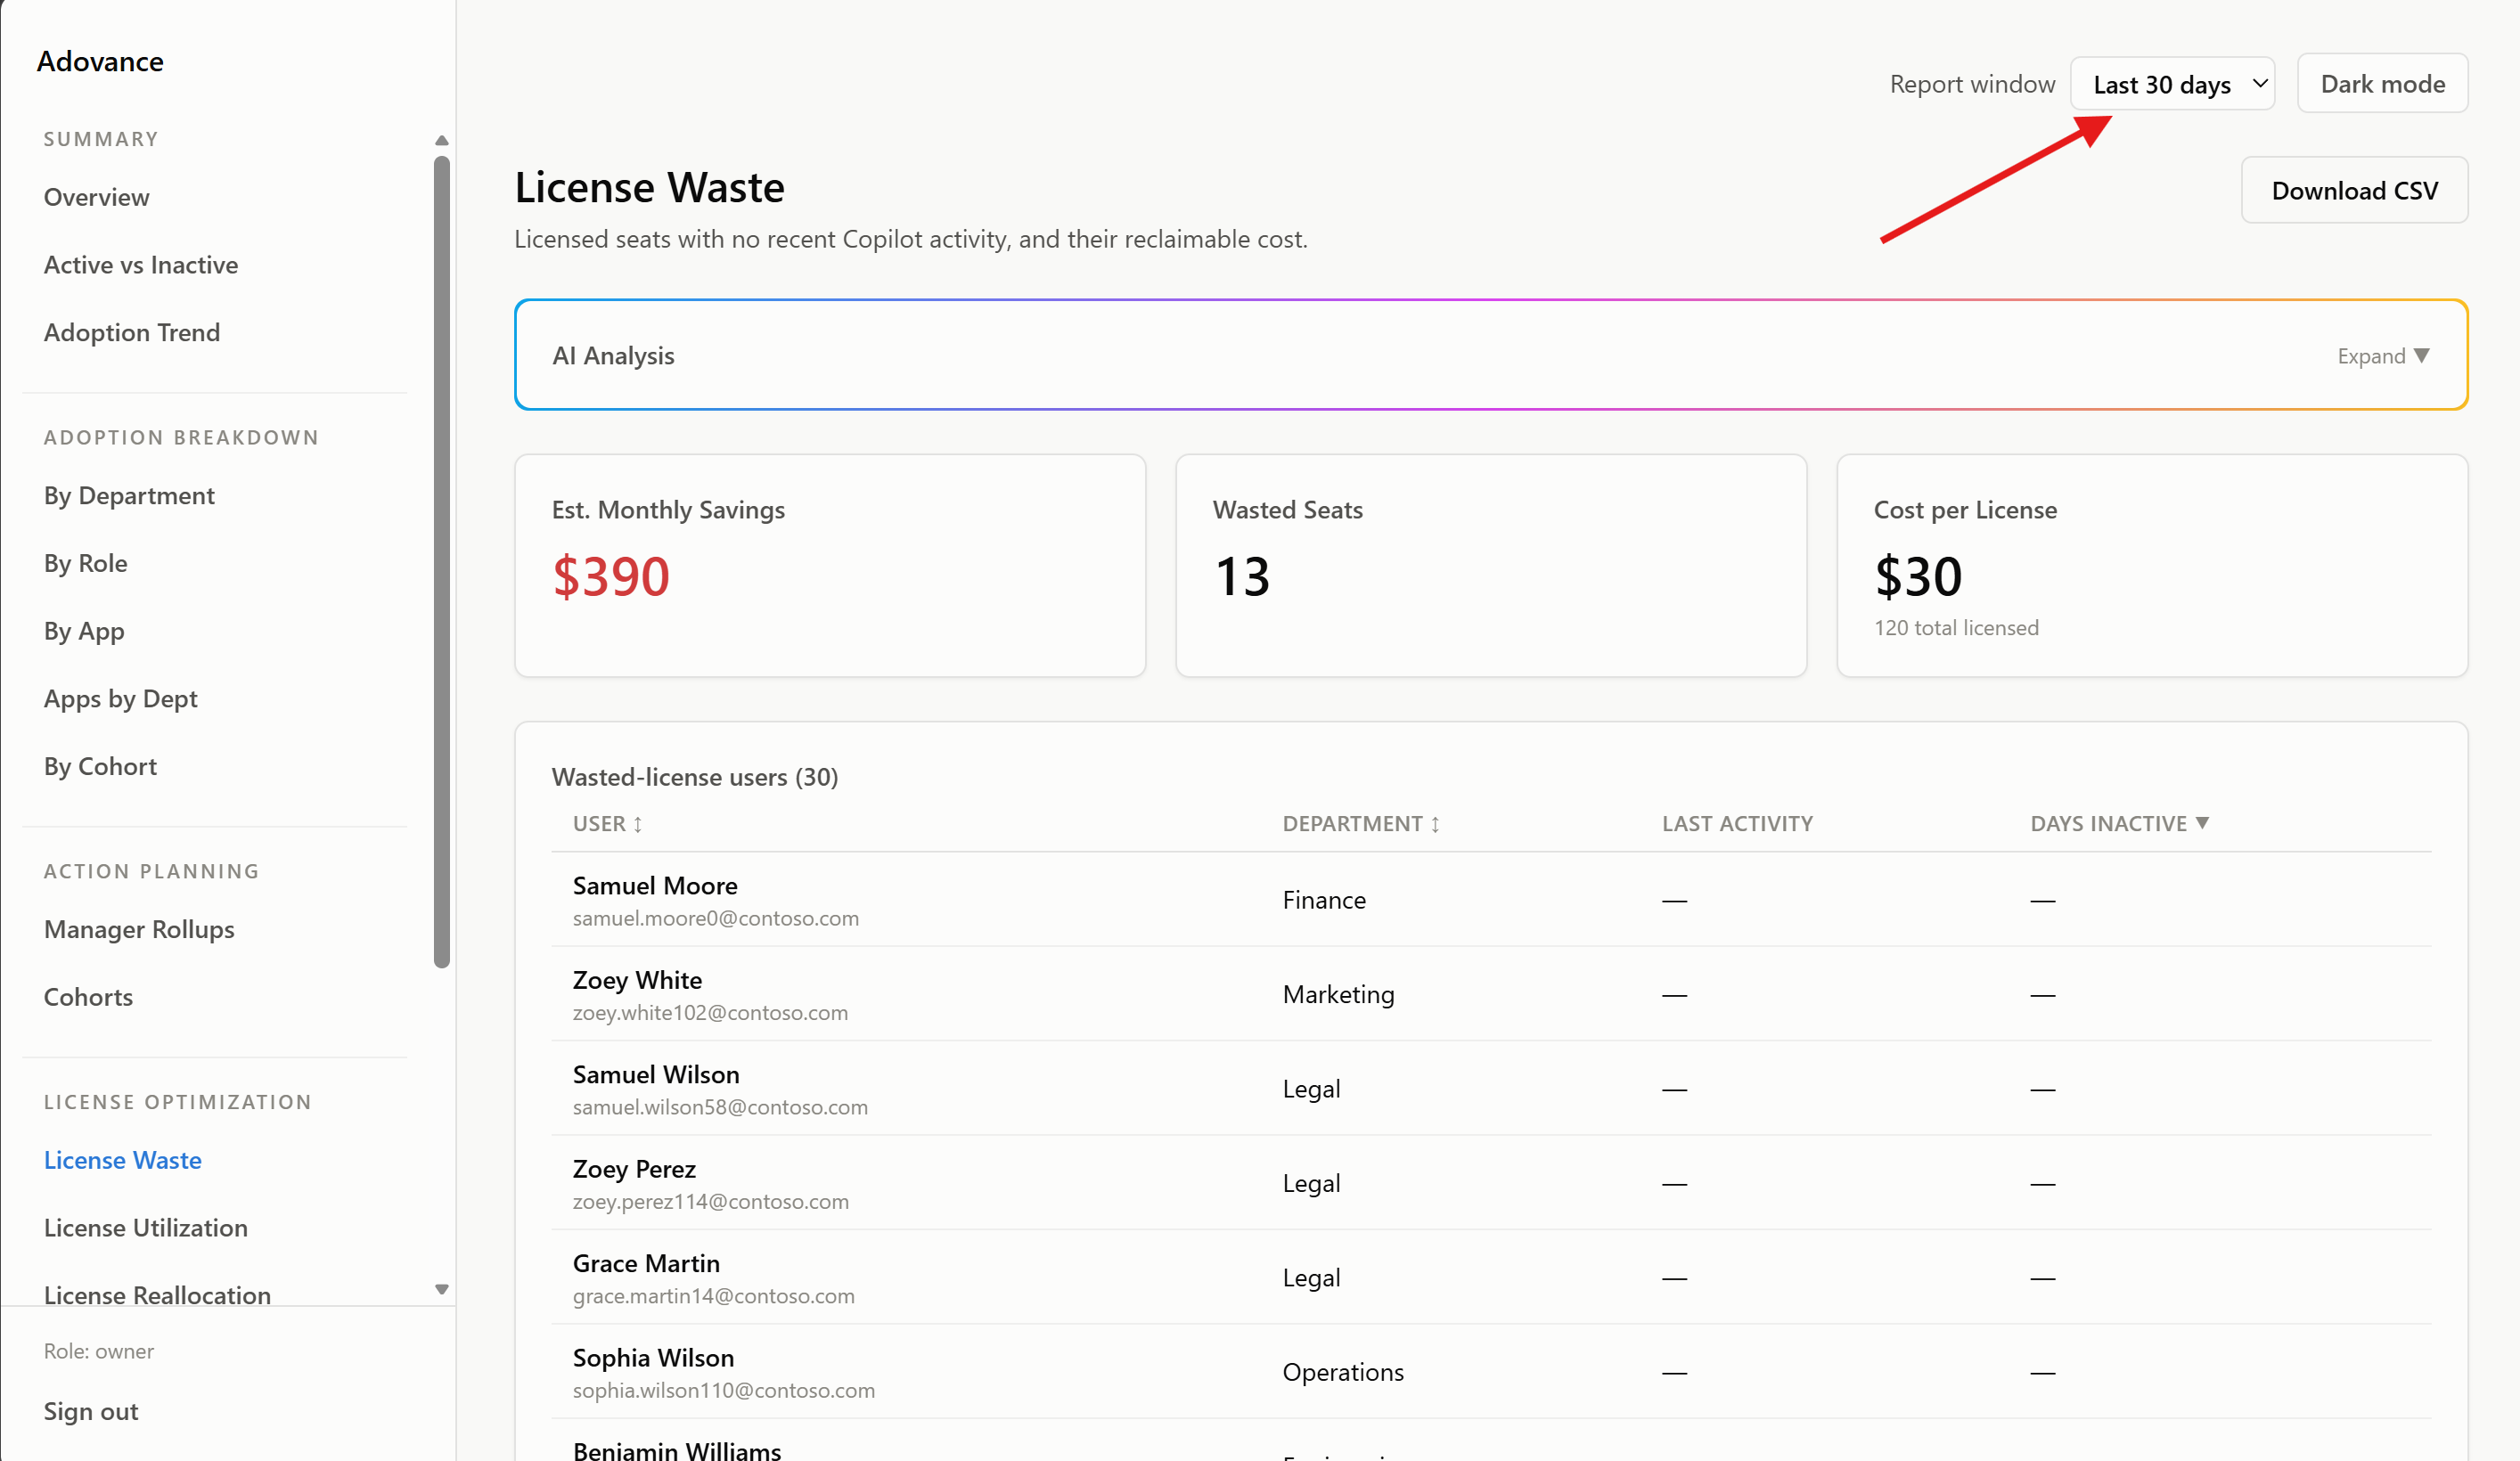
Most per-user reports let you choose a 7, 30, or 90 day window from the top-right. Changing it recomputes the page for that period.
Two reports - App Adoption and Adoption Trend - come from a different Microsoft Graph report family and are not affected by this selector.
The data-quality banner
If a sync matched 0 users despite Microsoft Graph returning rows, a persistent banner appears at the top of the dashboard. This almost always means the concealed user names setting is still turned on.
Shared controls on every report
| Control | What it does |
|---|---|
| AI Analysis | A written narrative and recommendation for that report |
| Download CSV | Exports the report’s underlying data |
| Report window | 7 / 30 / 90 day period (where applicable) |